


Long Term Power Law
Bitcoin's natural long-term power-law corridor of growth.
Data & charts updated every hour
This chart shows the Bitcoin price, an estimated date for the pi cycle top based on the recent slop, and three different price models that attempt to project Bitcoin's price:
- Stock to flow
- Power Law
- HPR Rainbow
The Pi Cycle Top Indicator is a technical tool used to identify potential peaks in Bitcoin's price cycles. Introduced by Philip Swift of LookIntoBitcoin in April 2019, it leverages two key moving averages to provide insight into when Bitcoin might be approaching a local or cycle top.
This chart takes the slope of both moving averages (111DMA and 350DMA x2) from the last 10 days and extrapolates them into the future to estimate when they might cross. The extrapolation continues until the lines intersect, which could indicate a potential future Pi Cycle Top signal.
The Pi Cycle Top occurs when the 111-day moving average (111DMA) moves up above and crosses the 350-day moving average multiplied by 2 (350DMA x 2). This crossover has historically signaled major Bitcoin cycle tops, making it a valuable tool for identifying potential market peaks.
The Bitcoin power law was created by Giovanni Santostasi
(@Giovann35084111 on Twitter) in 2015.
Giovanno is a physicist, neuroscientist, and financial analyst.
You can read his recent overview of how he created the model
here.
The power law aims to project the price of Bitcoin based on the following assumption:
Bitcoin's price, users, and mining power increase in a predictable way, like a city growing, where each part influences the others in a continuous feedback loop.
Stock to flow was created by PlanB in 2019.
Stock to flow is a model used to determine the scarcity of assets. The model can also be used to predict prices of assets based on scarcity.
Formula:
The formula for stock to flow is simple.
Stock to flow equals: Stock / Flow
Stock is the current amount of an asset.
Flow is the amount of an asset produced in a given year.
Let's say there are 20 million bitcoins, and 200,000 new bitcoins are issued each year.
Our equation would be:
20,000,000 total BTC / 200,000 new BTC per year = 100 stock to flow (S2F)
Based on this S2F value, a model is created to attempt to project the Bitcoin price based on scarcity.
The Halving Price Regression (HPR) is a non-linear regression curve calculated using only the Bitcoin prices on the Bitcoin halving dates.
This method excludes the hype cycles to create a conservative price estimate.

Bitcoin's natural long-term power-law corridor of growth.
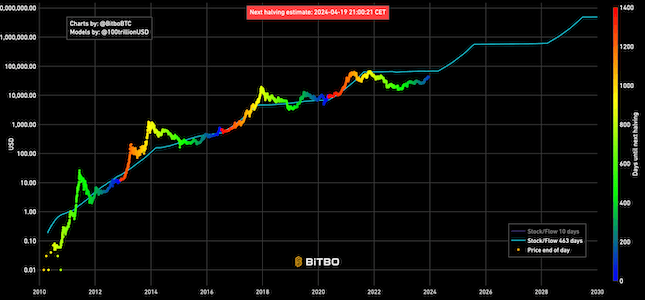
Shows the projected Bitcoin price based on version 1 of the stock to flow model.

A Bitcoin rainbow chart using only the halving dates as data.
Bitbo's charts section offers a wide range of Bitcoin charts and metrics.
If you have any questions, comments, or feedback please reach out to us via Twitter or via email at info@bitbo.io.