


Bitcoin Ancient Supply (10y+)
A chart showing the amount of Bitcoin that has not moved for at least 10 years.
Data & charts updated every hour
|
|
|
This chart shows the USD value of Bitcoin that was revived (moved after a period of dormancy) aggregated by the selected time period, broken down by how long the coins had been dormant before moving.
Age bands:
■ 6m–1y — Coins dormant 6 months to 1 year
■ 1y–2y — Coins dormant 1–2 years
■ 2y–3y — Coins dormant 2–3 years
■ 3y–5y — Coins dormant 3–5 years
■ 5y–7y — Coins dormant 5–7 years
■ 7y–10y — Coins dormant 7–10 years
■ 10y+ — Coins dormant 10+ years (ancient supply)
Use the period buttons to switch between Daily, Monthly, Quarterly, and Yearly views, and the USD/BTC toggle to show revived supply in dollar value or in coins. Large spikes in older age bands during bull markets indicate long-dormant holders distributing into strength.
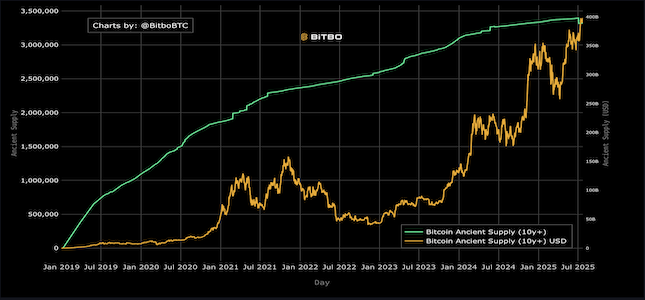
A chart showing the amount of Bitcoin that has not moved for at least 10 years.
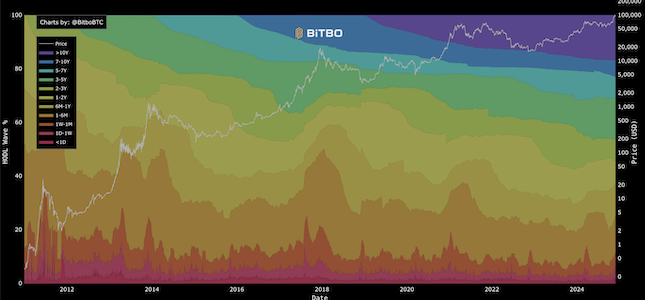
Visualizes the age distribution of Bitcoin's circulating supply over time.
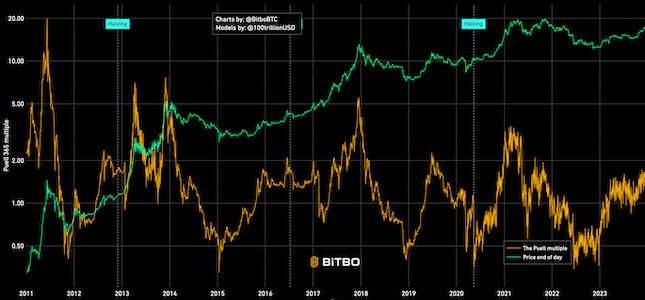
Shows the relation between BTC mined in a day (expressed in USD) and 365 day moving average.
Bitbo's charts section offers a wide range of Bitcoin charts and metrics.
If you have any questions, comments, or feedback please reach out to us via Twitter or via email at info@bitbo.io.