


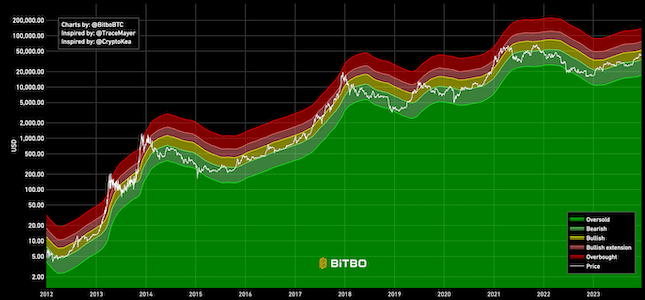
Mayer Bands
The Mayer Multiple Price Bands chart is a simple modification to the original Mayer Multiple.
Data & charts updated every hour
The Golden Ratio Multiplier shows the daily 350-day moving average of Bitcoin's price and compares it to that average multiplied by the Golden Ratio (1.6) and the Fibonacci sequence (0, 1, 1, 2, 3, 5, 8, 13, 21).
The reason for this comparison is because these multiples have been accurate in the past at determining local highs within a cycle as well as cycle long highs. If it continues to be reliable, then the Golden Ratio Multiplier may be of use to traders looking to determine if the current market is overbought relative to bitcoin adoption.
Bitbo's charts section offers a wide range of Bitcoin charts and metrics.
If you have any questions, comments, or feedback please reach out to us via Twitter or via email at info@bitbo.io.

