


Bitcoin Rainbow Chart
A Bitcoin rainbow chart using only the halving dates as data.
Chart & data updated every block
This chart shows Bitcoin's inflation since 2009 by month. For months where Bitcoin has existed, it uses the actual Bitcoin supply to calculate historical inflation.
For months that have not yet happened, it shows expected inflation using an estimated block time of 10 minutes.
The formula is the new bitcoins issued in a monthly divided by the current bitcoins for the month * 100.

A Bitcoin rainbow chart using only the halving dates as data.
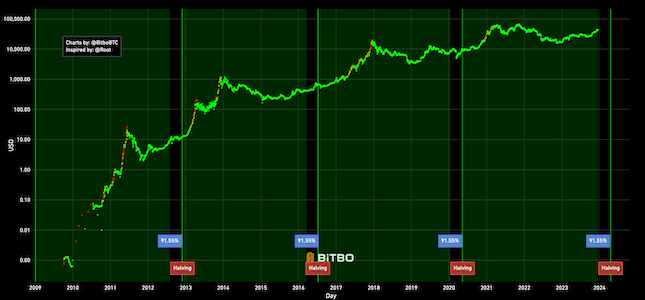
Shows Bitcoin's price in its current cycle compared to past cycles. Red dots indicate all-time highs.
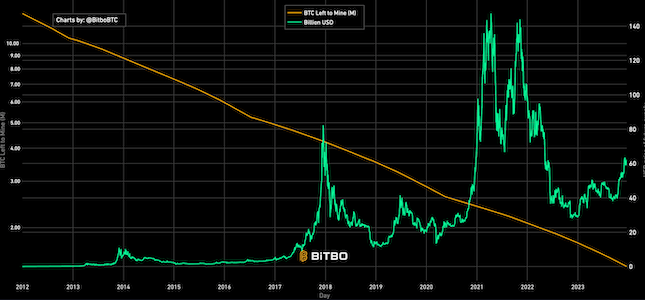
Shows the USD value of the future outstanding Bitcoin supply that has not been mined.
Bitbo's charts section offers a wide range of Bitcoin charts and metrics.
If you have any questions, comments, or feedback please reach out to us via Twitter or via email at info@bitbo.io.