Long Term Power Law
Bitcoin's natural long-term power-law corridor of growth.
Data & charts updated every hour
This page is inspired by Medium article Bitcoin’s power oscillator written by Twitter user hcburger1.
The power law oscillator chart is loosely related to our bitcoin long term power law chart. However, instead of focusing bitcoin’s future price, the power law oscillator asks whether bitcoin is currently under or oversold. To answer this question, a simple model is constructed. It takes bitcoin’s historical price data as its input. The oscillator has a range of 1 to -1, and it describes the log-price deviation between the current market price and the power-law fit from the beginning of bitcoin’s history to now.
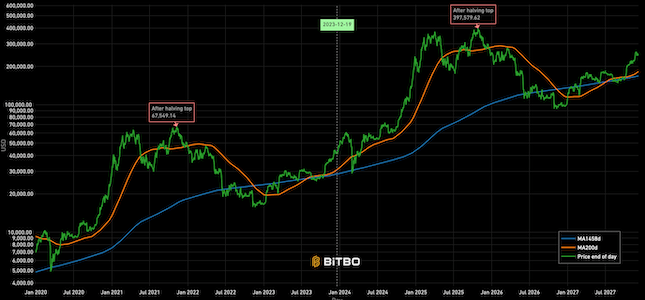
The interpretation of the power law oscillator is pretty straightforward. Market tops correlate with high oscillator values. Market bottoms correlate with low oscillator values. This is seen throughout the price history when back-modeling - each all-time-high was seen in a thin oscillator band. The bubbles then burst not long after entering that band.
Bitbo's charts section offers a wide range of Bitcoin charts and metrics.
If you have any questions, comments, or feedback please reach out to us via Twitter or via email at info@bitbo.io.