


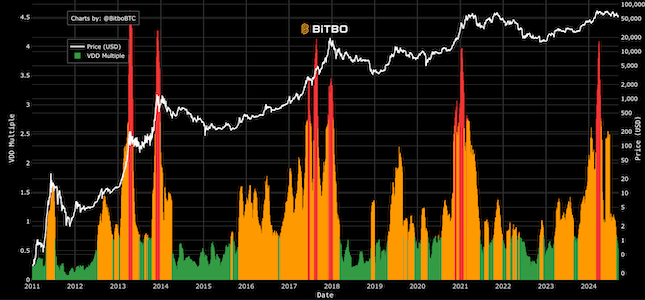
VDD Multiple
Tests the strength of spending behavior over time by comparing short-term spending velocity to a yearly average.
Data & charts updated every hour
The Network Value to Transactions (NVT) Ratio and its refined version, NVTS, are metrics used to assess Bitcoin's valuation relative to the value being transmitted on its network.
NVT Ratio is calculated by dividing the Network Value (market cap) by the USD volume transmitted through the blockchain daily. It's equivalent to dividing the Bitcoin token supply by the daily BTC value transmitted through the blockchain, making NVT technically an inverse of monetary velocity.
In standard charts, the NVT line is typically smoothed with a 14-day moving average to reduce noise.
NVTS, an improvement on the original NVT, uses a 90-day moving average of the Daily Transaction Value to provide a more stable metric.
Tests the strength of spending behavior over time by comparing short-term spending velocity to a yearly average.
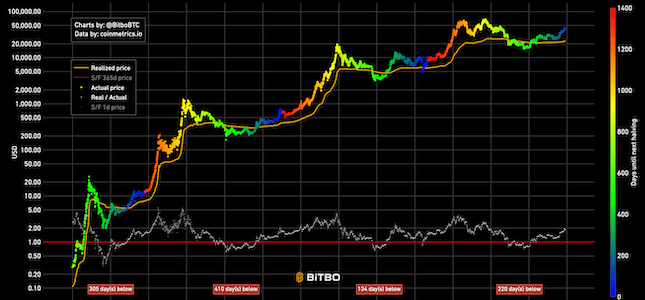
Realized price is the realized market cap divided by total amount of generated coins.
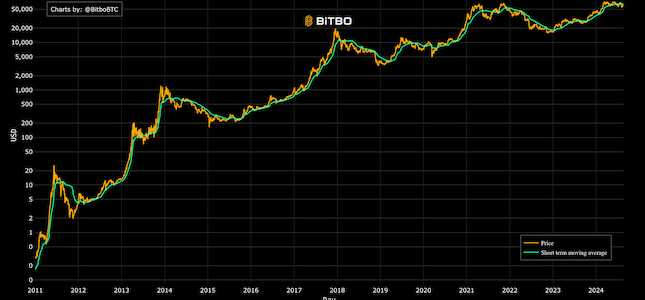
Shows the short term holder realized price and the price of Bitcoin.
Bitbo's charts section offers a wide range of Bitcoin charts and metrics.
If you have any questions, comments, or feedback please reach out to us via Twitter or via email at info@bitbo.io.