Bitcoin Rainbow Chart
A Bitcoin rainbow chart using only the halving dates as data.
Data & charts updated every hour
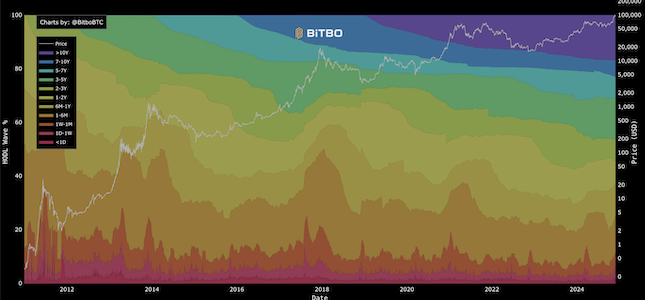
The "7YR HODL Wave" refers to the distribution of Bitcoin holders based on how long they have held their coins, specifically focusing on those who have held their Bitcoin for 7 years or more.
In other words:
The 7-YR HODL Wave stat represents the percentage or proportion of Bitcoin addresses (or wallets) that have held their Bitcoin for at least 7 years without conducting any outgoing transactions. It gives insights into the behavior of long-term holders who are willing to keep their Bitcoin investments for an extended period, rather than engaging in short-term trading or frequent buying and selling.
This metric is often used by analysts and investors to gauge the level of confidence and conviction in the Bitcoin market. A higher percentage of long-term hodlers could be interpreted as a sign of strong faith in the long-term potential of Bitcoin as an asset. Conversely, a decrease in the 7-year hodl wave could indicate increased selling activity and potential short-term market sentiment.
Bitbo's charts section offers a wide range of Bitcoin charts and metrics.
If you have any questions, comments, or feedback please reach out to us via Twitter or via email at info@bitbo.io.