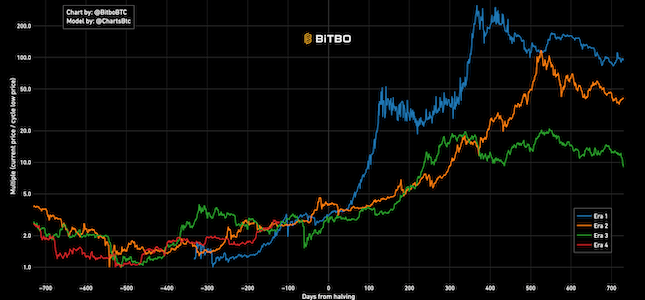
Cycle Low Multiple
Divides the bitcoin price history into eras. Each era represents the days within a block reward subsidy period.
Pick an indicator, set your buy and sell rules, and see how the strategy would have performed against Bitcoin's historical price.
Every buy and sell your strategy made, in order.
| Type | Date | BTC Price | Portfolio Value | P/L % | Cash Return |
|---|
This calculator allows you to backtest Bitcoin trading strategies based on technical indicators.
You can configure multiple indicators with custom entry and exit criteria using the form above the chart. The available indicators are:
After clicking calculate, the chart will display:
1. The green line shows Bitcoin's price movement during the backtest period.
2. The orange line represents your portfolio value in USD based on your strategy's trades.
3. Buy and sell signals are marked on the chart with annotations, showing when your strategy would have entered or exited positions.
4. The return percentage is displayed between the portfolio valuation and bitcoin price chart, with green indicating profit and red indicating loss.
Divides the bitcoin price history into eras. Each era represents the days within a block reward subsidy period.

Bitcoin's natural long-term power-law corridor of growth.

A Bitcoin rainbow chart using only the halving dates as data.


