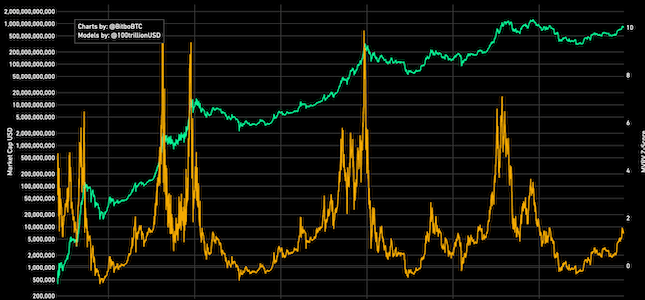
MVRV Z-Score
A chart showing Bitcoin's historical MVRV-z score.
Data & charts updated every hour
Upgrade to Bitbo Pro to view this chart.
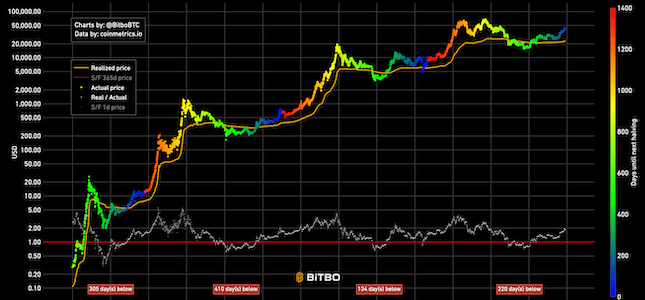
UpgradeEach line represents the 2 years before and after the current date in eras of 4 years.
The chart is scaled to the current era, so the current price of BTC is multiplied by the ratio of the era origin to the price at that given time in the era.
For example, if Bitcoin's price is currently $1000, but was was $100 on this day 8 years ago, and then price was $150 200 days later then the era scaled price would be (1000 * 150/100) = $1500.
Bitbo's charts section offers a wide range of Bitcoin charts and metrics.
If you have any questions, comments, or feedback please reach out to us via Twitter or via email at info@bitbo.io.