


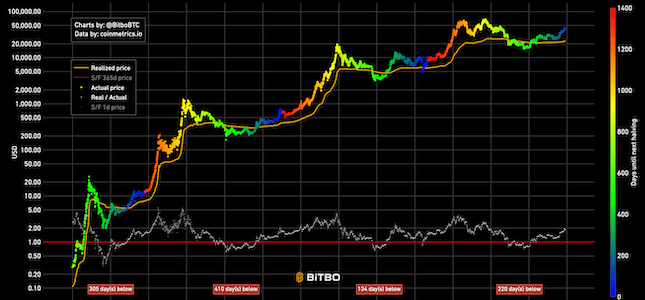
Realized Price
Realized price is the realized market cap divided by total amount of generated coins.
Upgrade to Bitbo Pro to view this chart.
UpgradeYearly ROI shows the Bitcoin price from the beginning of the year to the end of year, for each year of existence.
The line style indicates the ROI for that year:
Realized price is the realized market cap divided by total amount of generated coins.
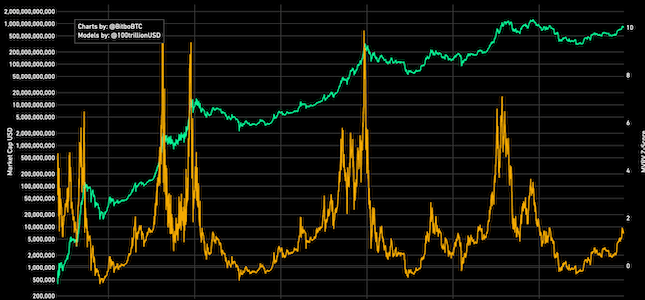
A chart showing Bitcoin's historical MVRV-z score.
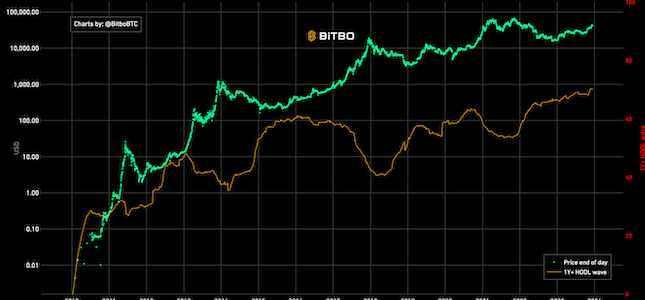
% of addresses that have not moved their bitcoins in more than 1 year.
Bitbo's charts section offers a wide range of Bitcoin charts and metrics.
If you have any questions, comments, or feedback please reach out to us via Twitter or via email at info@bitbo.io.