


Bitcoin Mining Difficulty
Historical mining difficulty. Shows green if the difficulty went up and red if it went down, compared to previous epoch.
Data & charts updated every hour
Latest Block
Current Pace
-36.77 blocks from expectation
Next Difficulty Estimate
321 blocks remaining
Estimated Retarget Time
Last: July 11th, 2026 at 8:09 PM
This chart shows the estimated next difficulty adjustment based on the current mining pace. The difficulty adjusts every 2016 blocks (approximately every 2 weeks) to maintain a 10-minute average block time.
The current pace is calculated by comparing the actual time taken to mine recent blocks against the expected 10-minute interval. A pace of 100% means blocks are being mined exactly on schedule, while values above 100% indicate faster mining and values below 100% indicate slower mining.
The adjustment ratio is capped between 0.25x and 4x to prevent extreme difficulty changes. The actual timespan is measured over the last 2016 blocks, and the expected timespan is 20160 minutes (14 days).
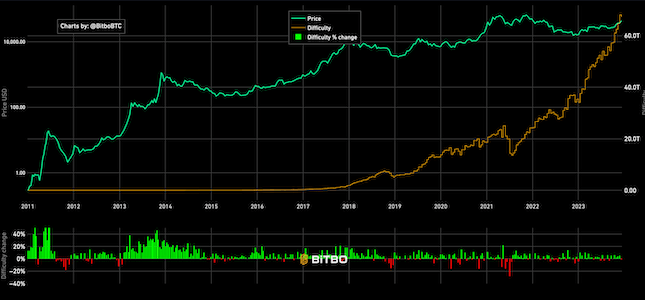
Historical mining difficulty. Shows green if the difficulty went up and red if it went down, compared to previous epoch.
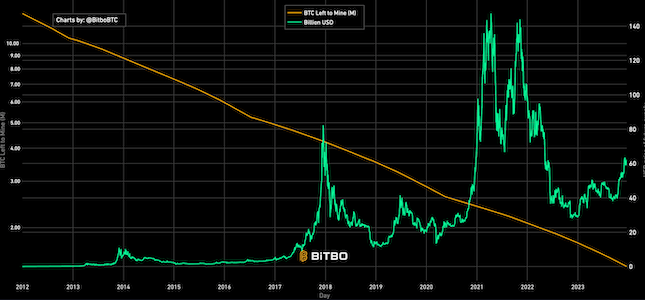
Shows the USD value of the future outstanding Bitcoin supply that has not been mined.
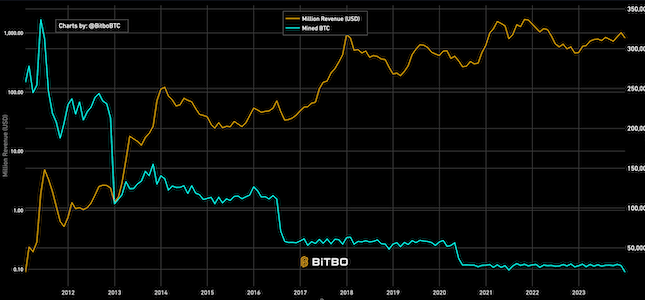
Shows the amount of revenue earned monthly by miners in USD and BTC.
Bitbo's charts section offers a wide range of Bitcoin charts and metrics.
If you have any questions, comments, or feedback please reach out to us via Twitter or via email at info@bitbo.io.