Bitcoin Rainbow Chart
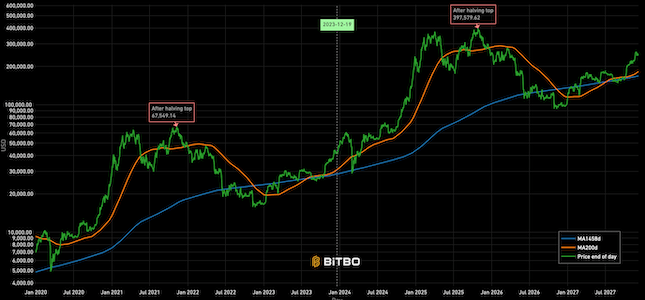
A Bitcoin rainbow chart using only the halving dates as data.
Data & charts updated every hour
The Sharpe ratio is an old formula used to value the risk-adjusted return of an asset. It was developed by Nobel Laureate William F. Sharpe. In this case, we have applied it to Bitcoin.
The Sharpe Ratio shows you the average return earned after subtracting out the risk-free rate per unit of volatility.
Volatility is a measure of the price fluctuations of an asset or portfolio. Subtracting the risk-free rate from the mean return allows you to understand what the extra returns are for taking the risk.
The risk-free rate of return is the profit you’d make on an investment with ‘zero risk’, such as a government bond. The Sharpe ratio is thus a way to see opportunity cost.
If a government bond pays 1% guaranteed and you are making 4% investing in Bitcoin, then you are effectively being paid an additional 3% for the added risk. Knowing what you are being paid for the risk you are taking makes you a more informed investor. In short, the higher the Sharpe Ratio, the better the risk adjusted return is.
- Rp = return of portfolio
- Rf = risk-free rate
- \large σ \scriptsize p = standard deviation of the portfolio’s excess return
Bitbo's charts section offers a wide range of Bitcoin charts and metrics.
If you have any questions, comments, or feedback please reach out to us via Twitter or via email at info@bitbo.io.