Bitcoin Rainbow Chart
A Bitcoin rainbow chart using only the halving dates as data.
Data & charts updated every hour
|
|
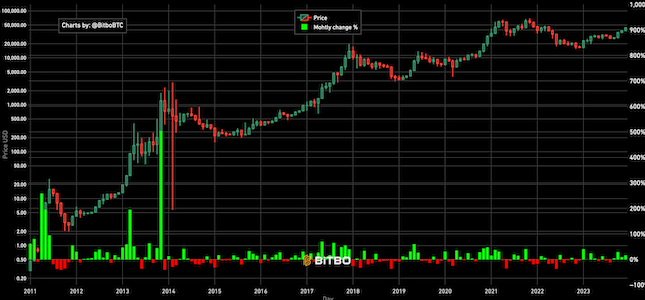
This chart uses color coding to display the amount of days that have passed since the last all time high in the Bitcoin price for any given day. This chart is sort of an inverse of the Never Look Back price.
We start at the earliest date in Bitcoin’s history (July 19, 2010) and start a day counter. Each day, we check the price. Each day the price does not go above the highest historical price, the day counter is increased by one. If the price ever goes higher than the historical high, the counter restarts at 0.
Bitbo's charts section offers a wide range of Bitcoin charts and metrics.
If you have any questions, comments, or feedback please reach out to us via Twitter or via email at info@bitbo.io.