


Long Term Power Law
Bitcoin's natural long-term power-law corridor of growth.
Data & charts updated every hour
Each band represents a different price range for Bitcoin. The bands are based on percentages of the Stock to Flow projected Price.
Read more on stock to flow here.

Bitcoin's natural long-term power-law corridor of growth.

Shows 4 Bitcoin price models: power law, stock to flow, stock to income, and HPR Rainbow.
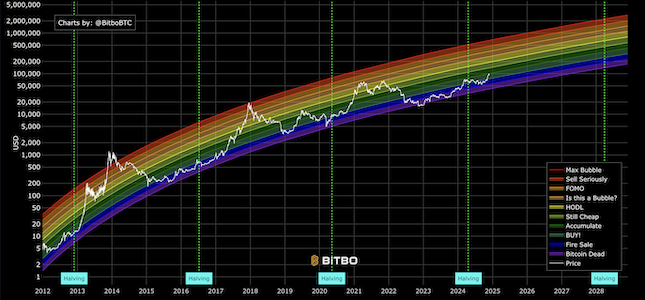
The original Bitcoin rainbow price chart showing logarithmic regression bands.
Bitbo's charts section offers a wide range of Bitcoin charts and metrics.
If you have any questions, comments, or feedback please reach out to us via Twitter or via email at info@bitbo.io.