


RSI
The Relative Strength Index (RSI) is a momentum based visualization.
Data & charts updated every hour
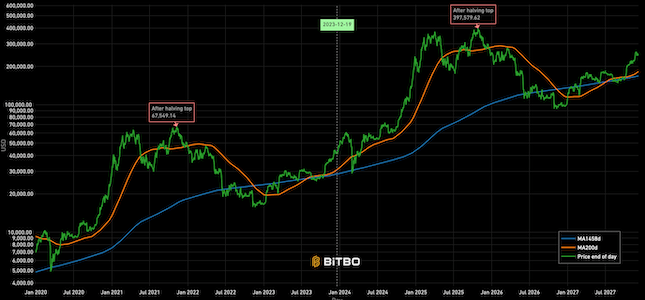
This chart shows the Bitcoin price and the 200-week moving average.
Many have noticed that when the Bitcoin 200-week moving average crosses the previous cycle top price, this has historically marked the top of the current cycle.
This chart monitors the 200-week moving average and price, and will show a new vertical cross when the 200-week moving average crosses the previous cycle top price.
Note that this indicator missed the 2021 cycle top. The cycle high was hit without the 200-week moving average crossing the previous cycle top price.

The Relative Strength Index (RSI) is a momentum based visualization.
Projection of Bitcoin's price from today's price based on a repeat of previous cycle.

A Bitcoin rainbow chart using only the halving dates as data.
Bitbo's charts section offers a wide range of Bitcoin charts and metrics.
If you have any questions, comments, or feedback please reach out to us via Twitter or via email at info@bitbo.io.