RSI
The Relative Strength Index (RSI) is a momentum based visualization.
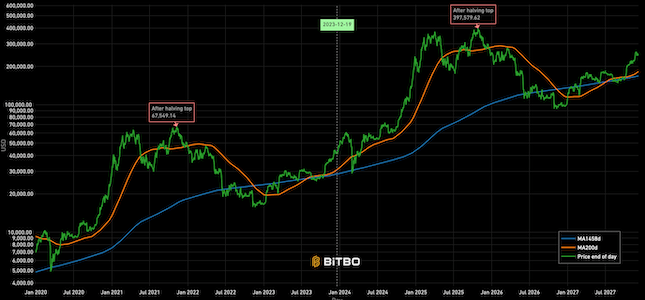
Data & charts updated every hour
Bollinger Bands are a technical analysis tool that was invented by John Bollinger in the 1980s. They are used to measure the volatility of a financial asset, like Bitcoin, over a specified period of time. Bollinger Bands comprise three lines: a middle band representing a simple moving average (typically 20-day), and two outer bands that are standard deviations away from the middle band.
The middle band is a simple moving average (SMA) of the asset's price over a specific period, usually 20 days.
The outer bands are two standard deviations away from the middle band. They represent the upper and lower limits of the asset's price movement.
Bollinger Bands expand and contract based on the volatility of the asset. When the bands expand, it indicates an increase in volatility, while contraction suggests a decrease in volatility. Traders use Bollinger Bands to identify potential overbought or oversold conditions in the market.
%B shows where the price sits within the bands. A value of 1 means price is touching the upper band, 0 means it is touching the lower band, and 0.5 means it is at the middle band (SMA 20). Values above 1 or below 0 indicate price has closed outside the bands.
Bandwidth measures how wide the bands are relative to the middle band. Low bandwidth signals a "squeeze" — a period of low volatility that often precedes a large price move — while high bandwidth reflects elevated volatility.
Bitbo's charts section offers a wide range of Bitcoin charts and metrics.
If you have any questions, comments, or feedback please reach out to us via Twitter or via email at info@bitbo.io.