RSI
The Relative Strength Index (RSI) is a momentum based visualization.
Data & charts updated every hour
|
|
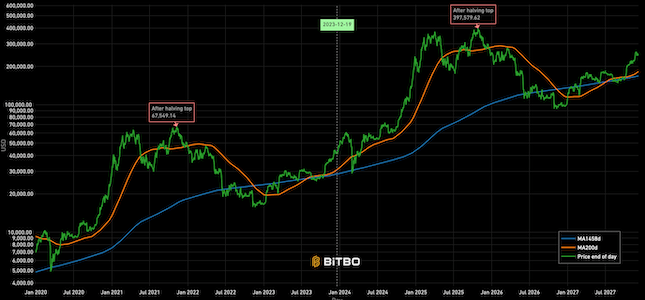
The Mayer Multiple Price Bands chart is a simple modification to the original Mayer Multiple chart explained here.
The Mayer Multiple is calculated by taking the price of Bitcoin and dividing it by the 200 day moving average value. The thinking behind the multiple is that by comparing the current price of bitcoin and its longer term moving average, you get a sense of if it is overbought (overvalued) or oversold (undervalued).
The addition of price bands takes the multiple a step further by attempting to tell you how overbought or oversold bitcoin is with more detail. Instead of just three labels (overbought, fairly priced, and undervalued), you are given more granular labels: Oversold, Bearish, Bullish, Bullish Extension, and Overbought.
The Mayer multiple is calculated by taking the price of Bitcoin and dividing it by the 200 day moving average value. We take this a step further and display various prices that represent ‘bands’ of over and undervalued Bitcoin based on the multiple. They are as follows:
<0.55x: Oversold
>0.55x and <1.1x: Bearish Channel
>1.1x and <1.7x Bullish Channel
>1.7x and <2.5x: Bullish Overextension
>2.5x: Overbought
Bitbo's charts section offers a wide range of Bitcoin charts and metrics.
If you have any questions, comments, or feedback please reach out to us via Twitter or via email at info@bitbo.io.