


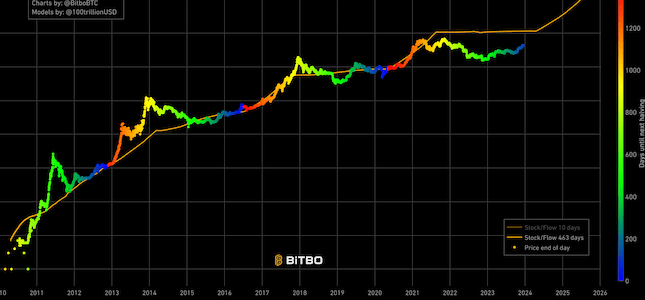
Stock to Flow
Shows the projected Bitcoin price based on the stock to flow model.
Chart & data updated every block
This is a simple chart that shows Segwit adoption over time. A historical view of what percent of wallets with greater than 0 bitcoins in them are Segwit wallets.
We take all active Segwit addresses (active meaning they hold Bitcoins) in them and divide that by the total number of active Bitcoin addresses. Limitations of this chart: Many users own both Segwit and legacy addresses and so it’s hard to objectively measure Segwit adoption.
Shows the projected Bitcoin price based on the stock to flow model.
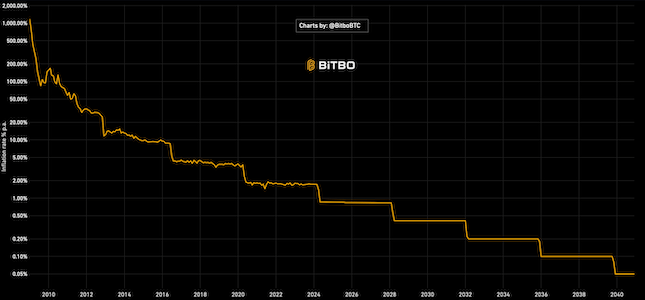
Bitcoin inflation since 2009. For past months, it uses actual BTC supply. For future months, it shows expected inflation.
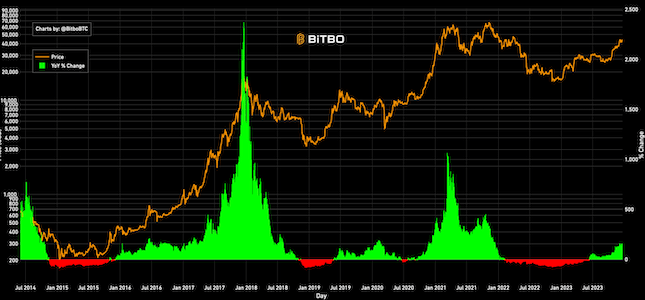
Shows the price of Bitcoin and its year over year price change.
Bitbo's charts section offers a wide range of Bitcoin charts and metrics.
If you have any questions, comments, or feedback please reach out to us via Twitter or via email at info@bitbo.io.