Bitcoin Rainbow Chart
A Bitcoin rainbow chart using only the halving dates as data.
Data & charts updated every hour
|
|
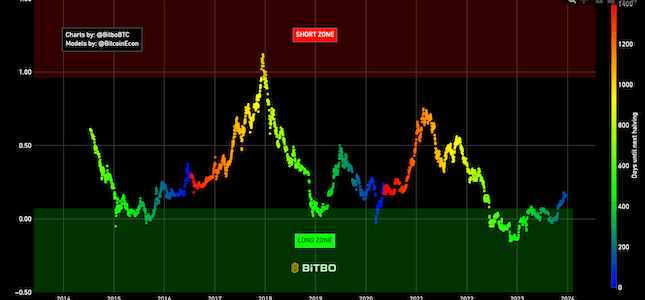
The 4 years multiple chart shows what multiple the end of day price of bitcoin is on a day compared to the same day 4 years before. The color legend on the right side of the chart represents how many days are left until the next halving.
Bitbo's charts section offers a wide range of Bitcoin charts and metrics.
If you have any questions, comments, or feedback please reach out to us via Twitter or via email at info@bitbo.io.