


Stock to Flow
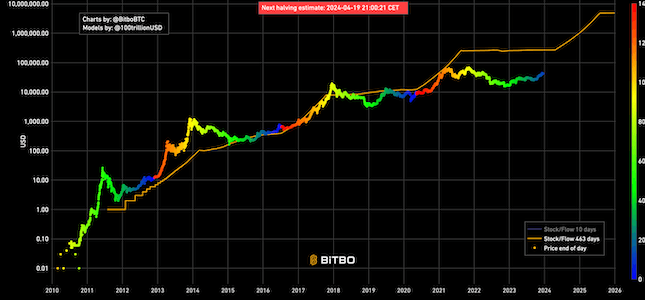
Shows the projected Bitcoin price based on the stock to flow model.
Data & charts updated every hour
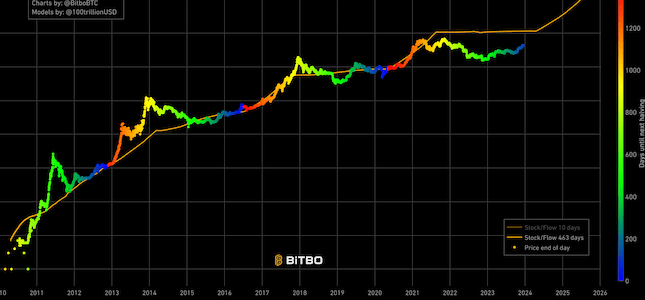
This chart shows the Bitcoin stock to flow model price compared to actual closing price of Bitcoin for any given day.
Stock to flow is a value calculated when total number of Bitcoins in circulation is divided by number of Bitcoins generated in a day and then divided by 12. It shows how many years is needed in order to produce all Bitcoins currently in circulation. The higher the number the higher scarcity. If the scarcity is higher then the price goes up. Why is this important? Because every {num_f x=210000} blocks there is an event called "halving" which means that reward for mining Bitcoin is cut by half which means monthly production is also cut by half. That makes stock to flow ratio (scracity) higher so in theory price should go up.
On the chart above, X axis is showing days and Y multiple value of current price against model price. Different colors represent number of days until next halving (see color bar on right side).
Shows the projected Bitcoin price based on the stock to flow model.
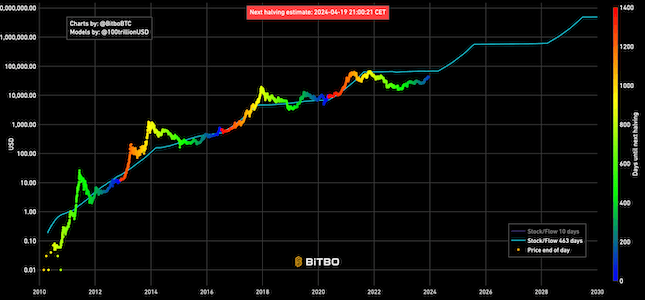
Shows the projected Bitcoin price based on the cross-asset version of the stock to flow model.
Shows the projected Bitcoin price based on version 1 of the stock to flow model.
Bitbo's charts section offers a wide range of Bitcoin charts and metrics.
If you have any questions, comments, or feedback please reach out to us via Twitter or via email at info@bitbo.io.