


Bitcoin Rainbow Chart
A Bitcoin rainbow chart using only the halving dates as data.
Data & charts updated every hour
BEAM stands for "Bitcoin Economics Adaptive Multiple". BEAM divides the price of bitcoin at any given moment to a moving average of past prices. Like the Mayer multiple, the purpose of this chart is to indicate if Bitcoin is under or overvalued at any given time.
There are three types of zones:
1. Green buy zone: value of 0.07 and lower - buy Bitcoin.
2. Red sell zone: value of 0.96 or higher - sell Bitcoin.
3. Gray hodl zone: begins 8 months before and ends 8 months after each halving event - hodl Bitcoin.
At the start of the hodl zone there is usually also a new buying opportunity.
The following is taken from BitcoinEconomics.io:
Price(n) is the price at the point in time that BEAM is calculated for. n runs from day 1 that a price existed to today’s price, with n going up to more than 3,600 for 10 years of Bitcoin price history. The basis of BEAM is a moving average (MA), which averages all previous prices for a certain period of time. For CycleLength we have to substitute 200 weeks or 1,400 days as this is the average cycle length of Bitcoin (if we exclude the first atypical cycle). As we also want to have values for the first 1,400 days, we have to gradually increase the Cycle Length value from 1 to 1,400, which is expressed by min(n,1,400). This takes care of the first, shorter cycle.

A Bitcoin rainbow chart using only the halving dates as data.
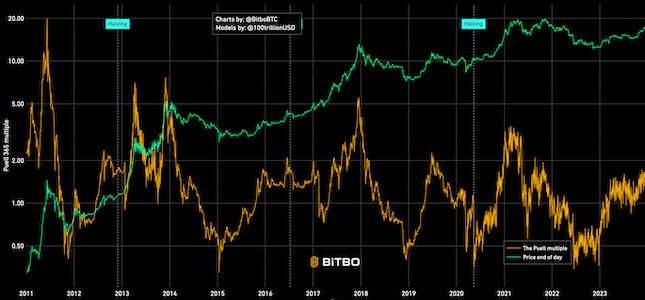
Shows the relation between BTC mined in a day (expressed in USD) and 365 day moving average.
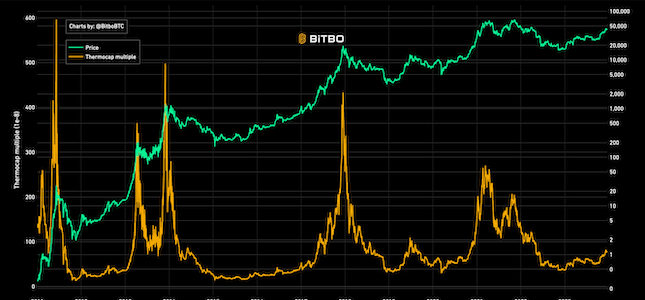
The ratio between the cumulative mined BTC (the block subsidy) and the current price.
Bitbo's charts section offers a wide range of Bitcoin charts and metrics.
If you have any questions, comments, or feedback please reach out to us via Twitter or via email at info@bitbo.io.