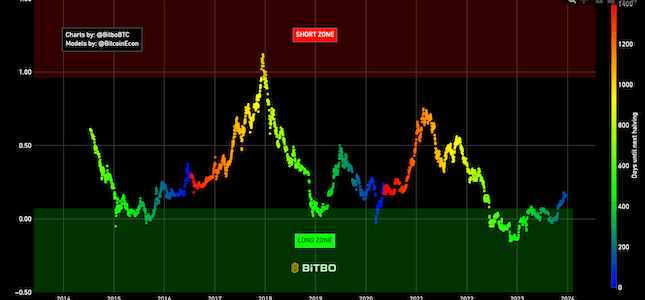
Bitcoin Rainbow Chart
A Bitcoin rainbow chart using only the halving dates as data.
Data & charts updated every hour
The NLB price is the last time bitcoin reached a certain price and has never since returned to it. After reaching that price, it has only been higher since that time. Hence why the chart is always positive. For instance, for most of 2018, the NLB was $3,232, meaning that $3,232 is the highest price that Bitcoin never dipped below at any point. This chart helps us to understand how the traditional concept of “time value of money” equates to Bitcoin adoption rates. This chart also represents various floor values for Bitcoin over time. The NLB is therefore a sustainable price for Bitcoin over a long time period. For more detail on this chart, you can read the original inventors paper on it here.
We start at the earliest date in bitcoin’s history (July 19, 2010) and then find the lowest price from that day until the next day - this price becomes the NLB. Each day following, we test to see if the Bitcoin price dips below the NLB. If it does, we update that price to be the new NLB. If it doesn’t, the NLB remains the same until the price dips below the NLB.
Bitbo's charts section offers a wide range of Bitcoin charts and metrics.
If you have any questions, comments, or feedback please reach out to us via Twitter or via email at info@bitbo.io.