


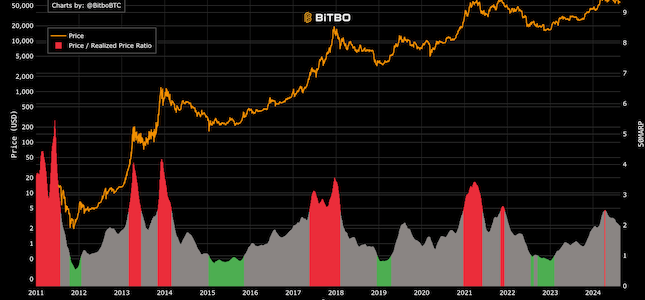
50MARP
Comparison of the 50-day realized price moving average vs a 50-day moving average of price.
Data & charts updated every hour
This chart shows the Bitcoin price after each halving, but scaled relative to the most recent halving (2024) and its price.
This allows you to view:
1. The rate at which Bitcoin is going up or down in this halving cycle vs previous cycles
2. What the price of Bitcoin could be if it follows the same growth rate compared to previous halvings
Comparison of the 50-day realized price moving average vs a 50-day moving average of price.
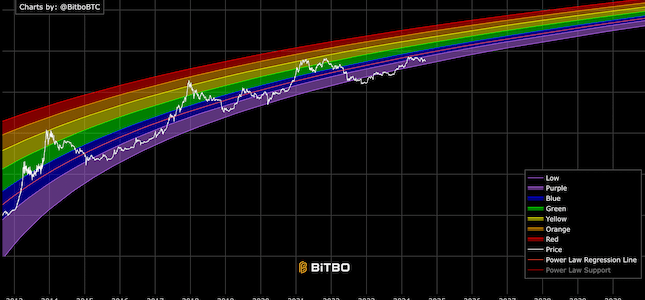
A rainbow chart based on the Bitcoin power law and time.
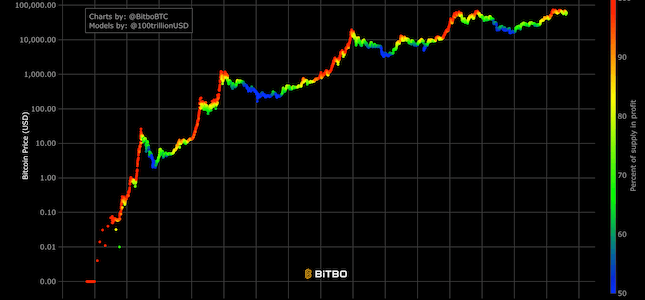
Shows the percent of bitcoin in profit with color-coding of the price.
Bitbo's charts section offers a wide range of Bitcoin charts and metrics.
If you have any questions, comments, or feedback please reach out to us via Twitter or via email at info@bitbo.io.