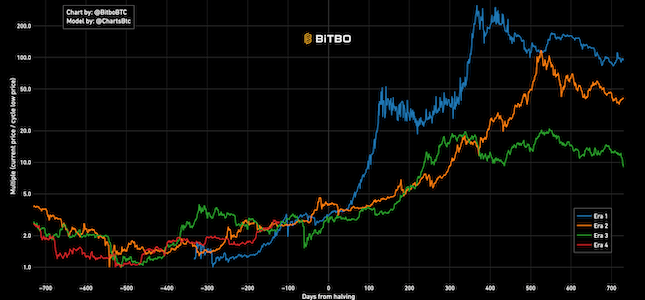
Cycle Low Multiple
Divides the bitcoin price history into eras. Each era represents the days within a block reward subsidy period.
Compare the cost of taking a loan against your Bitcoin versus selling BTC to raise the same amount of cash.
Borrow $1,000.00 and keep your Bitcoin
Sell 0.01 BTC at today's price
🔵 Loan Scenario: You keep all your Bitcoin and take out a loan against it. You make monthly interest payments but retain full ownership of your BTC. At the end of the term, you pay back the principal.
🟡 Sell Scenario: You sell enough Bitcoin at the starting price to raise the same amount of cash as the loan amount, reducing your Bitcoin holdings.
🔵 Loan Scenario: Origination fee (if any) + Monthly interest payments + Principal repayment at the end
🟡 Sell Scenario: Value of BTC you no longer hold at the end price + Capital gains tax (if any)
🔵 Loan Cost: Every dollar you pay in interest, fees, and principal repayment
🟡 Selling Cost: The opportunity cost - the value of Bitcoin you no longer hold at the end of the loan term
1. Loan Amount: The amount of cash you want to access
2. APR: The annual interest rate percentage (e.g., 12 for 12% APR)
3. Term: Duration of the loan in months
4. Starting BTC Price: Bitcoin price when you take the loan or sell BTC
5. Loan End BTC Price: Bitcoin price at the end of the loan term
The chart displays the cumulative cost comparison between both scenarios over time, showing which approach costs more under different Bitcoin price movements.
Divides the bitcoin price history into eras. Each era represents the days within a block reward subsidy period.

Bitcoin's natural long-term power-law corridor of growth.

A Bitcoin rainbow chart using only the halving dates as data.


