


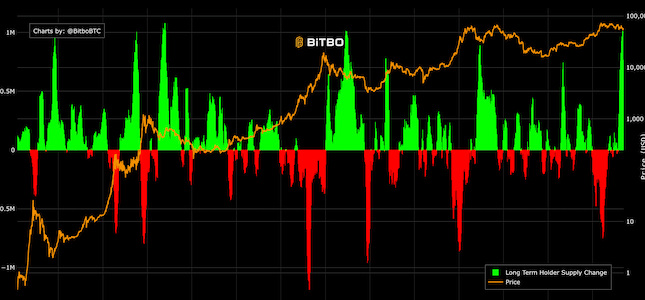
Long Term Holder Supply Change
The current amount of BTC held by LTHs compared to the amount held 30 days prior.
Upgrade to Bitbo Pro to view this chart.
UpgradeThis chart centers on the short-term holder realized price, which is the average cost basis of coins that moved within the last 155 days.
The two dotted bands are built by multiplying the STH realized price by the mean STH MVRV plus or minus one standard deviation. The calc toggle lets you switch between using the full available history and only the trailing 10 years to compute those band multipliers.
The background highlights show when BTC is trading outside the band structure: red when price is below the lower band, and green when price is above the upper band.
STH MVRV, like MVRV-Z, is used to determine if bitcoin is far above or below its realized value.
While MVRV-z is calculated based on the realized price of all coins, STH MVRV is more sensitive as it looks only at coin movement by short term holders (coins not moved in the last 155 days).
This view is useful for spotting periods when price is stretched below or above the short-term holder cost basis framework.
The current amount of BTC held by LTHs compared to the amount held 30 days prior.
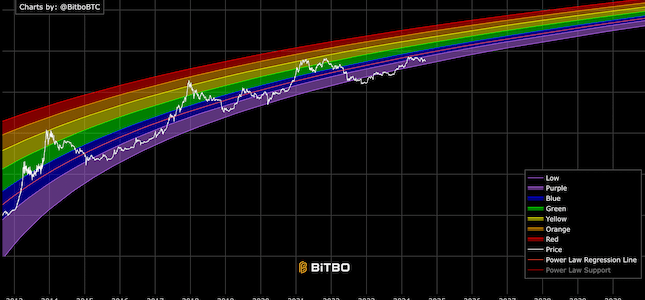
A rainbow chart based on the Bitcoin power law and time.
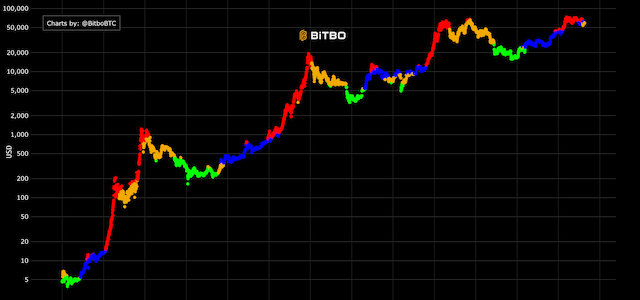
Attempts to pinpoint Bitcoin's cycles based on on-chain data.
Bitbo's charts section offers a wide range of Bitcoin charts and metrics.
If you have any questions, comments, or feedback please reach out to us via Twitter or via email at info@bitbo.io.