


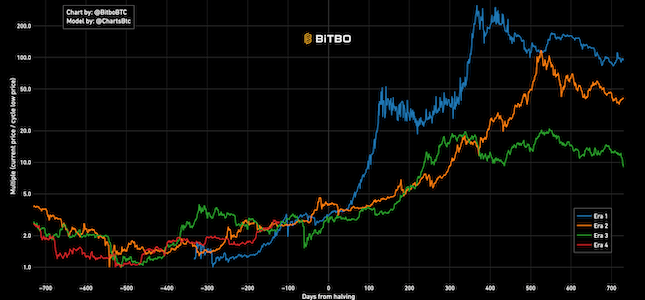
Cycle Low Multiple
Divides the bitcoin price history into eras. Each era represents the days within a block reward subsidy period.
Data & charts updated every hour
|
|
This chart takes price movements of the past 1,458 days and repeats those movements again to predict the price on each day over the coming 1,458 days. It also displays the previous after-halving top price as well as the tops after each upcoming halving.
The future 1,458 day projections should be taken only as estimates. The entire chart’s accuracy depends on Bitcoin’s behavior to repeat itself perfectly. There are many reasons why bitcoin might over or underperform its previous 1,458 day behavior. This chart should be viewed as theoretical only.
Divides the bitcoin price history into eras. Each era represents the days within a block reward subsidy period.

Bitcoin's natural long-term power-law corridor of growth.

A Bitcoin rainbow chart using only the halving dates as data.
Bitbo's charts section offers a wide range of Bitcoin charts and metrics.
If you have any questions, comments, or feedback please reach out to us via Twitter or via email at info@bitbo.io.