


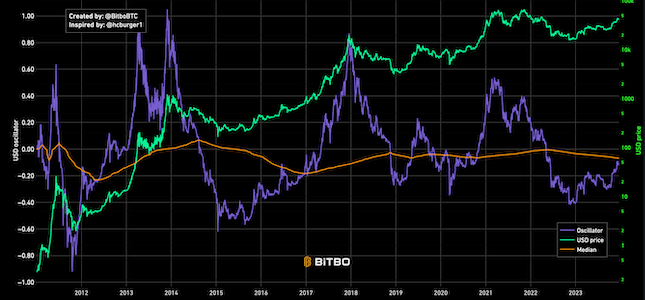
Power Law Oscillator
A chart showing Bitcoin's price vs the power law.
Data & charts updated every hour
Where the current price sits between support (0%) and resistance (100%).
Estimated Price = A × (days from GB)n
Estimated dates when the power law fair price line crosses key price levels, compared to when Bitcoin actually reached that price.
| Price | Model Estimate | Actually Reached | Difference |
|---|
Yearly averages of actual Bitcoin price vs. power law model prediction. Deviation is the average daily deviation from fair price across the year.
| Year | Avg. Actual Price | Avg. Fair Price | Avg. Deviation | R² (cumulative) |
|---|
Average monthly deviation of Bitcoin's actual price from the power law fair price. Green = undervalued, red = overvalued relative to the model.
Estimate investment returns based on the power law model. Uses the fair price projection to estimate future BTC prices.
Find the estimated date when the power law support line permanently exceeds a given price. After this date, the model predicts BTC will never go below that price.
Look up what the power law model predicts for any date. Enter a date to see the projected fair price, support, and resistance.
This chart is inspired by @Giovann35084111's post on reddit.
This chart is derived by taking two bands of bitcoin prices.
- A resistance price above the current price
- A support price below the current price
These resistance and support bands were derived by taking a linear regression of the historical bitcoin price to derive a "power law". This power law is just a straight line to represent the correlation between bitcoin's price and time. This line is then perfectly copied (including its slope) twice. With these two new lines,
- One is lowered such that the historical bitcoin price is always equal to or greater than the prices hitting that
line - the support line.
- One is raised such that the historical bitcoin price is always equal to or less than the prices hitting that
line - the resistance line.
Using this chart, two conclusions (or perhaps, assumptions) are made.
1. The price will reach $100,000 per bitcoin no earlier than 2021 and no later than 2028. After 2028, the price
will never drop below $100,000.
2. The price will reach $1,000,000 per bitcoin no earlier than 2028 and no later than 2037. After 2037, the price
will never drop below $1,000,000.
As always, the logic of this chart and the assumptions derived from it depend on bitcoin's previous performance being indicative of the future. That is always the case when relying on any sort of linear regression. However, unanticipated events may drastically alter that behavior in the future, so one should not take the price predictions made by this chart as gospel.
The Bitcoin Power Law model was created by Giovanni Santostasi, a physicist and neuroscientist. First shared as a Reddit post in 2018, the model applies power law dynamics -- commonly found in natural and social phenomena -- to Bitcoin's price history. Santostasi's key insight was that Bitcoin's price, when plotted on a log-log scale against time (days since the genesis block), forms a remarkably straight line, suggesting the price follows a power law relationship rather than exponential growth.

