Close sidebar
-
S2F Bands Pro
Close sidebar
-
Revived Supply Pro
-
Market Cycles Pro
-
STH SOPR Pro
-
LTH SOPR Pro
-
SOPR Ratio Pro
-
STH NUPL Pro
-
LTH NUPL Pro
-
MVRV Bands Pro
Close sidebar
-
50 MARP Momentum Pro
Close sidebar
-
CAGR Scenarios Pro
Close sidebar
-
50 MARP Pro
Close sidebar
Close sidebar
Close sidebar
-
ROI From Peaks Pro
-
Yearly ROI Pro
Close sidebar
Close sidebar
-
Stocks vs BTC Pro
-
MSTR-BTC Ratio Pro
Close sidebar
Close sidebar
Close sidebar
Close sidebar
-
MVRV Crosses Pro
Close sidebar
Close sidebar
-
Supply In Profit Pro
-
Ancient Supply Pro
Close sidebar
-
MSTR BTC/Share Pro
-
MSTR Nav Premium Pro
Close sidebar
Close sidebar
-
4y Comparison Pro
-
DXY vs BTC Pro
-
SP500-Gold Ratio Pro
Exclusive TradingView Indicators
| Bitbo Pro | Bitbo Pro++ |
|---|---|
| Stock to Flow Expected Price | All 15 Bitbo Pro Indicators |
| Stock to Flow Variance | Long Term Power Law Divergence |
| Cycle Repeat | Rainbow Halving Regression Divergence |
| 50MARP Momentum | Realized Price Divergence |
| Long Term Power Law | Mayer Bands |
| Power Law Rainbow | Thermocap |
| 1458-Day (4Year) SMA Heatmap | BEAM |
| Real Bitcoin Dominance | 50MARP |
| Realized Price | 180-Day Realized Price Change |
| Price Colored by Days Until Halving | Realized Price Momentum |
| Rainbow Halving Regression | Bitcoin Market Cycles |
| Golden Ratio | |
| NUPL | |
| Halving Progress | |
| Hash Price | |
| Stock to Flow Value | |
| Get Bitbo Pro Indicators | Get Bitbo Pro++ Indicators |
Stock to Flow
Stock to flow price, variance, and value.
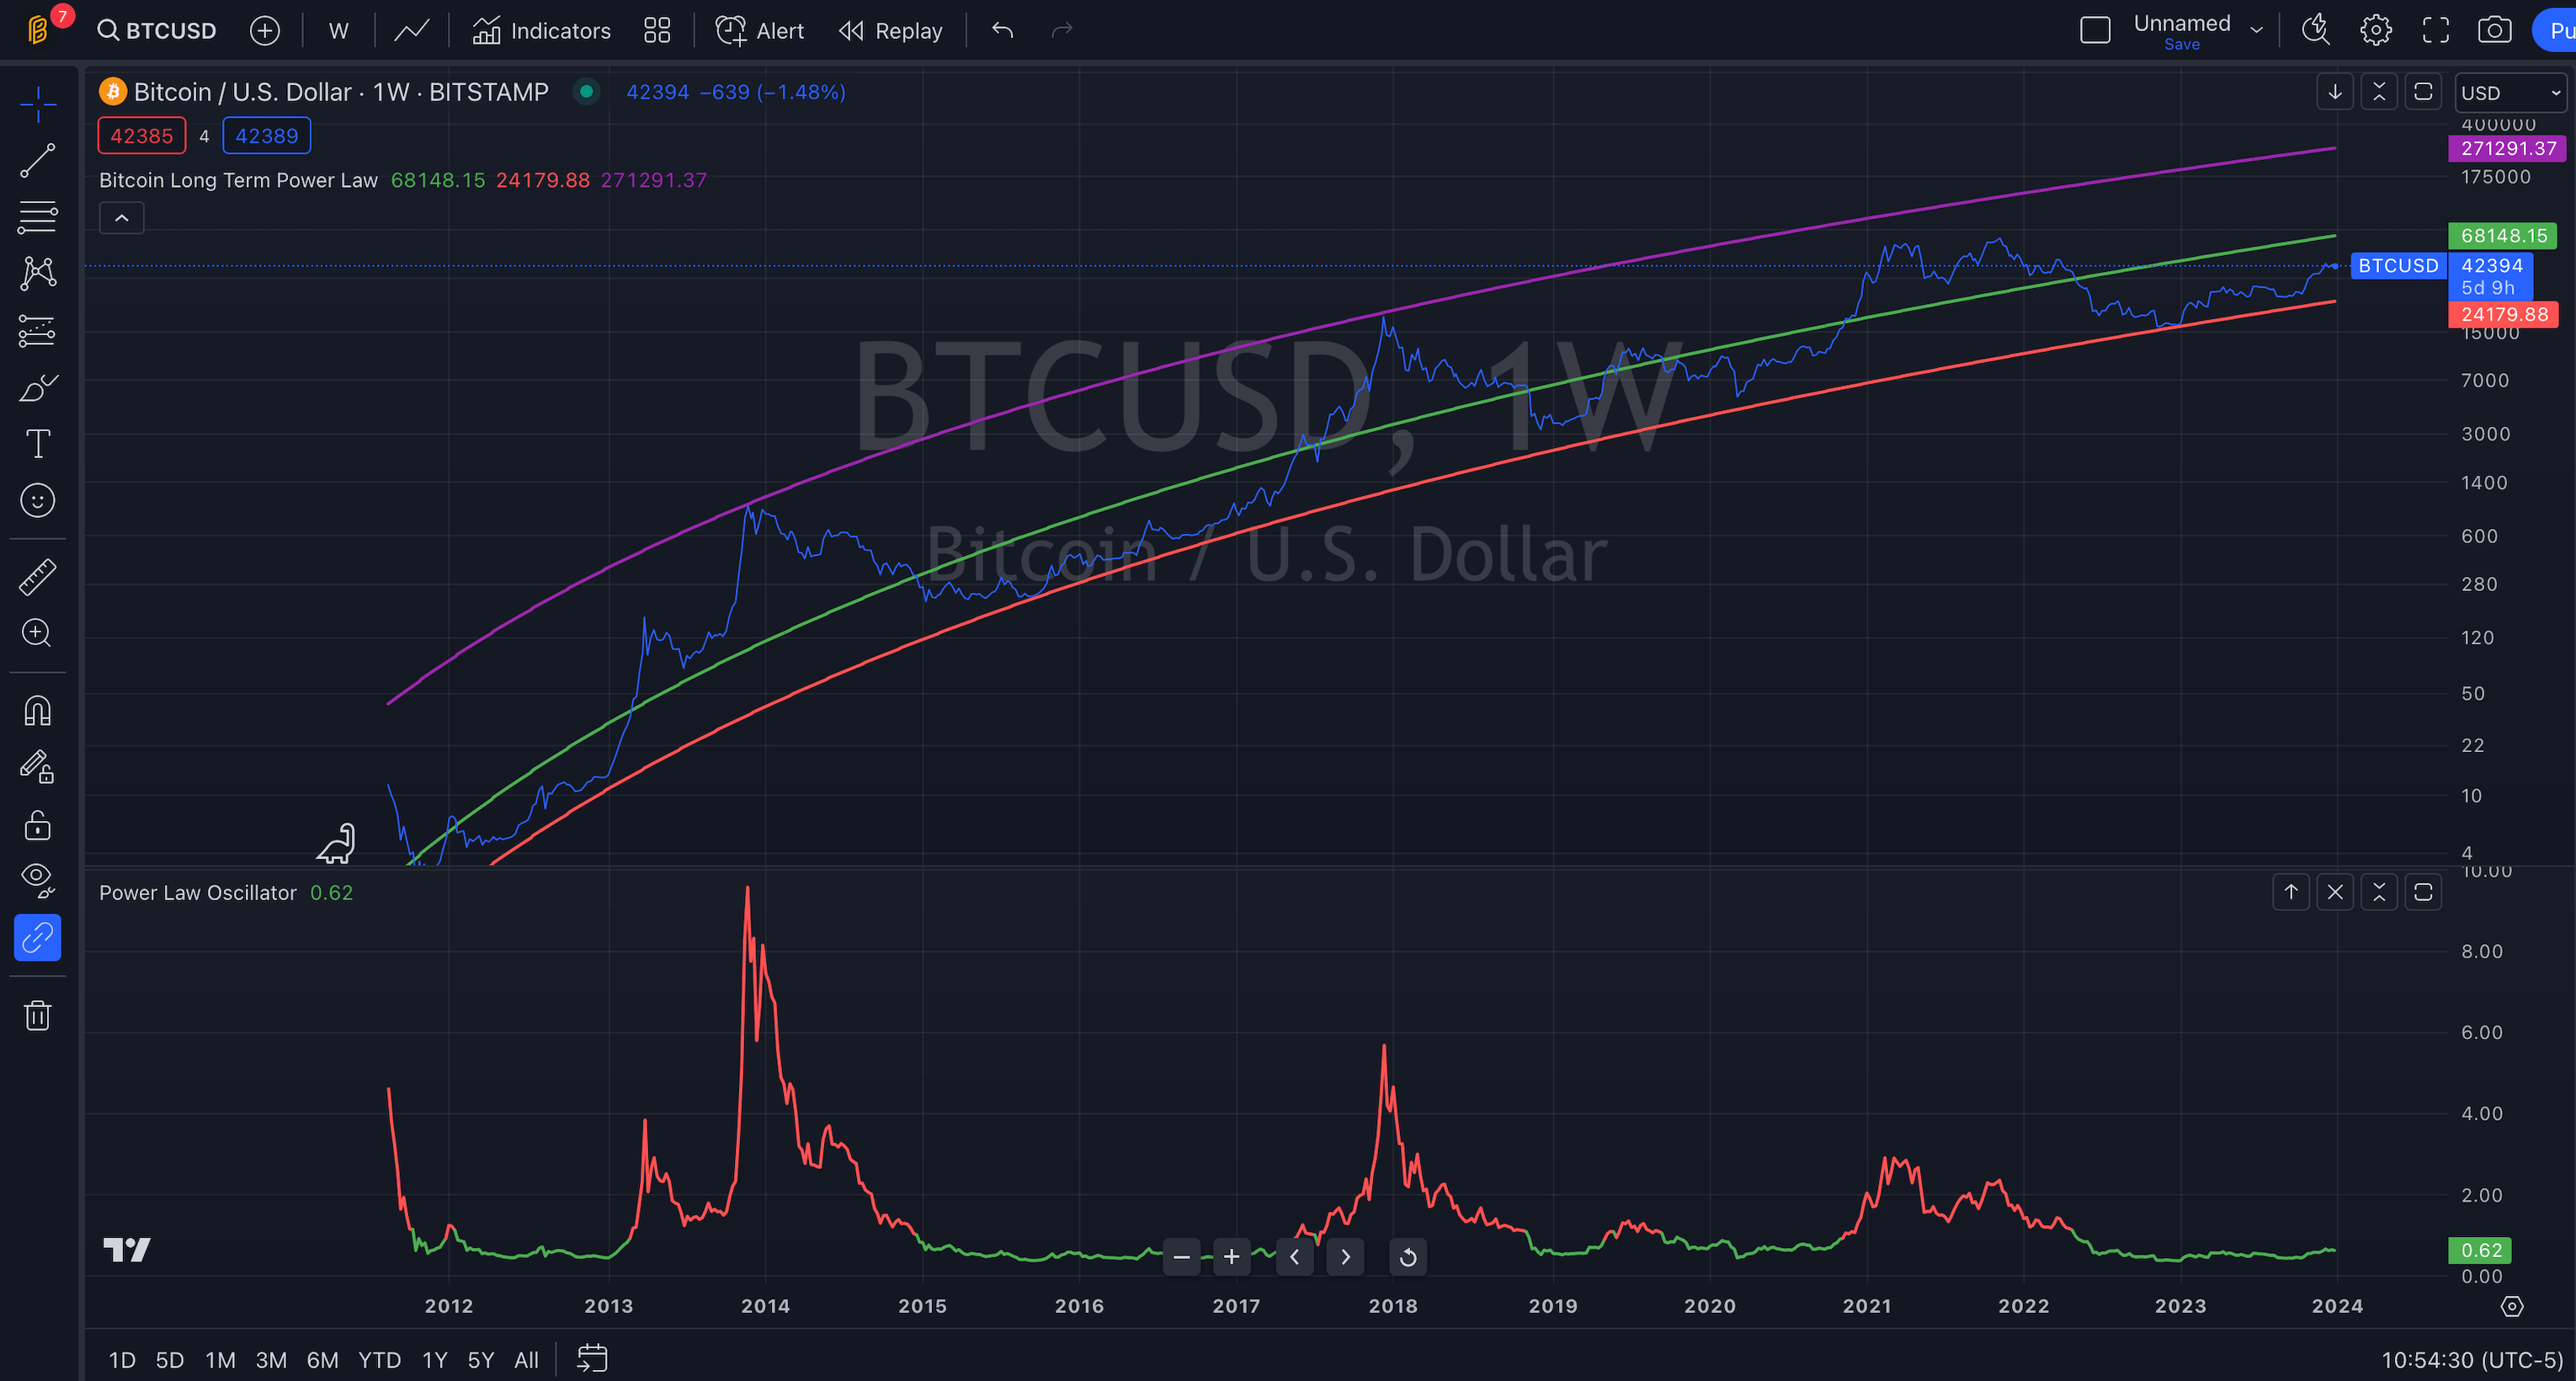
Power Law
Power law and price vs power law expected price.
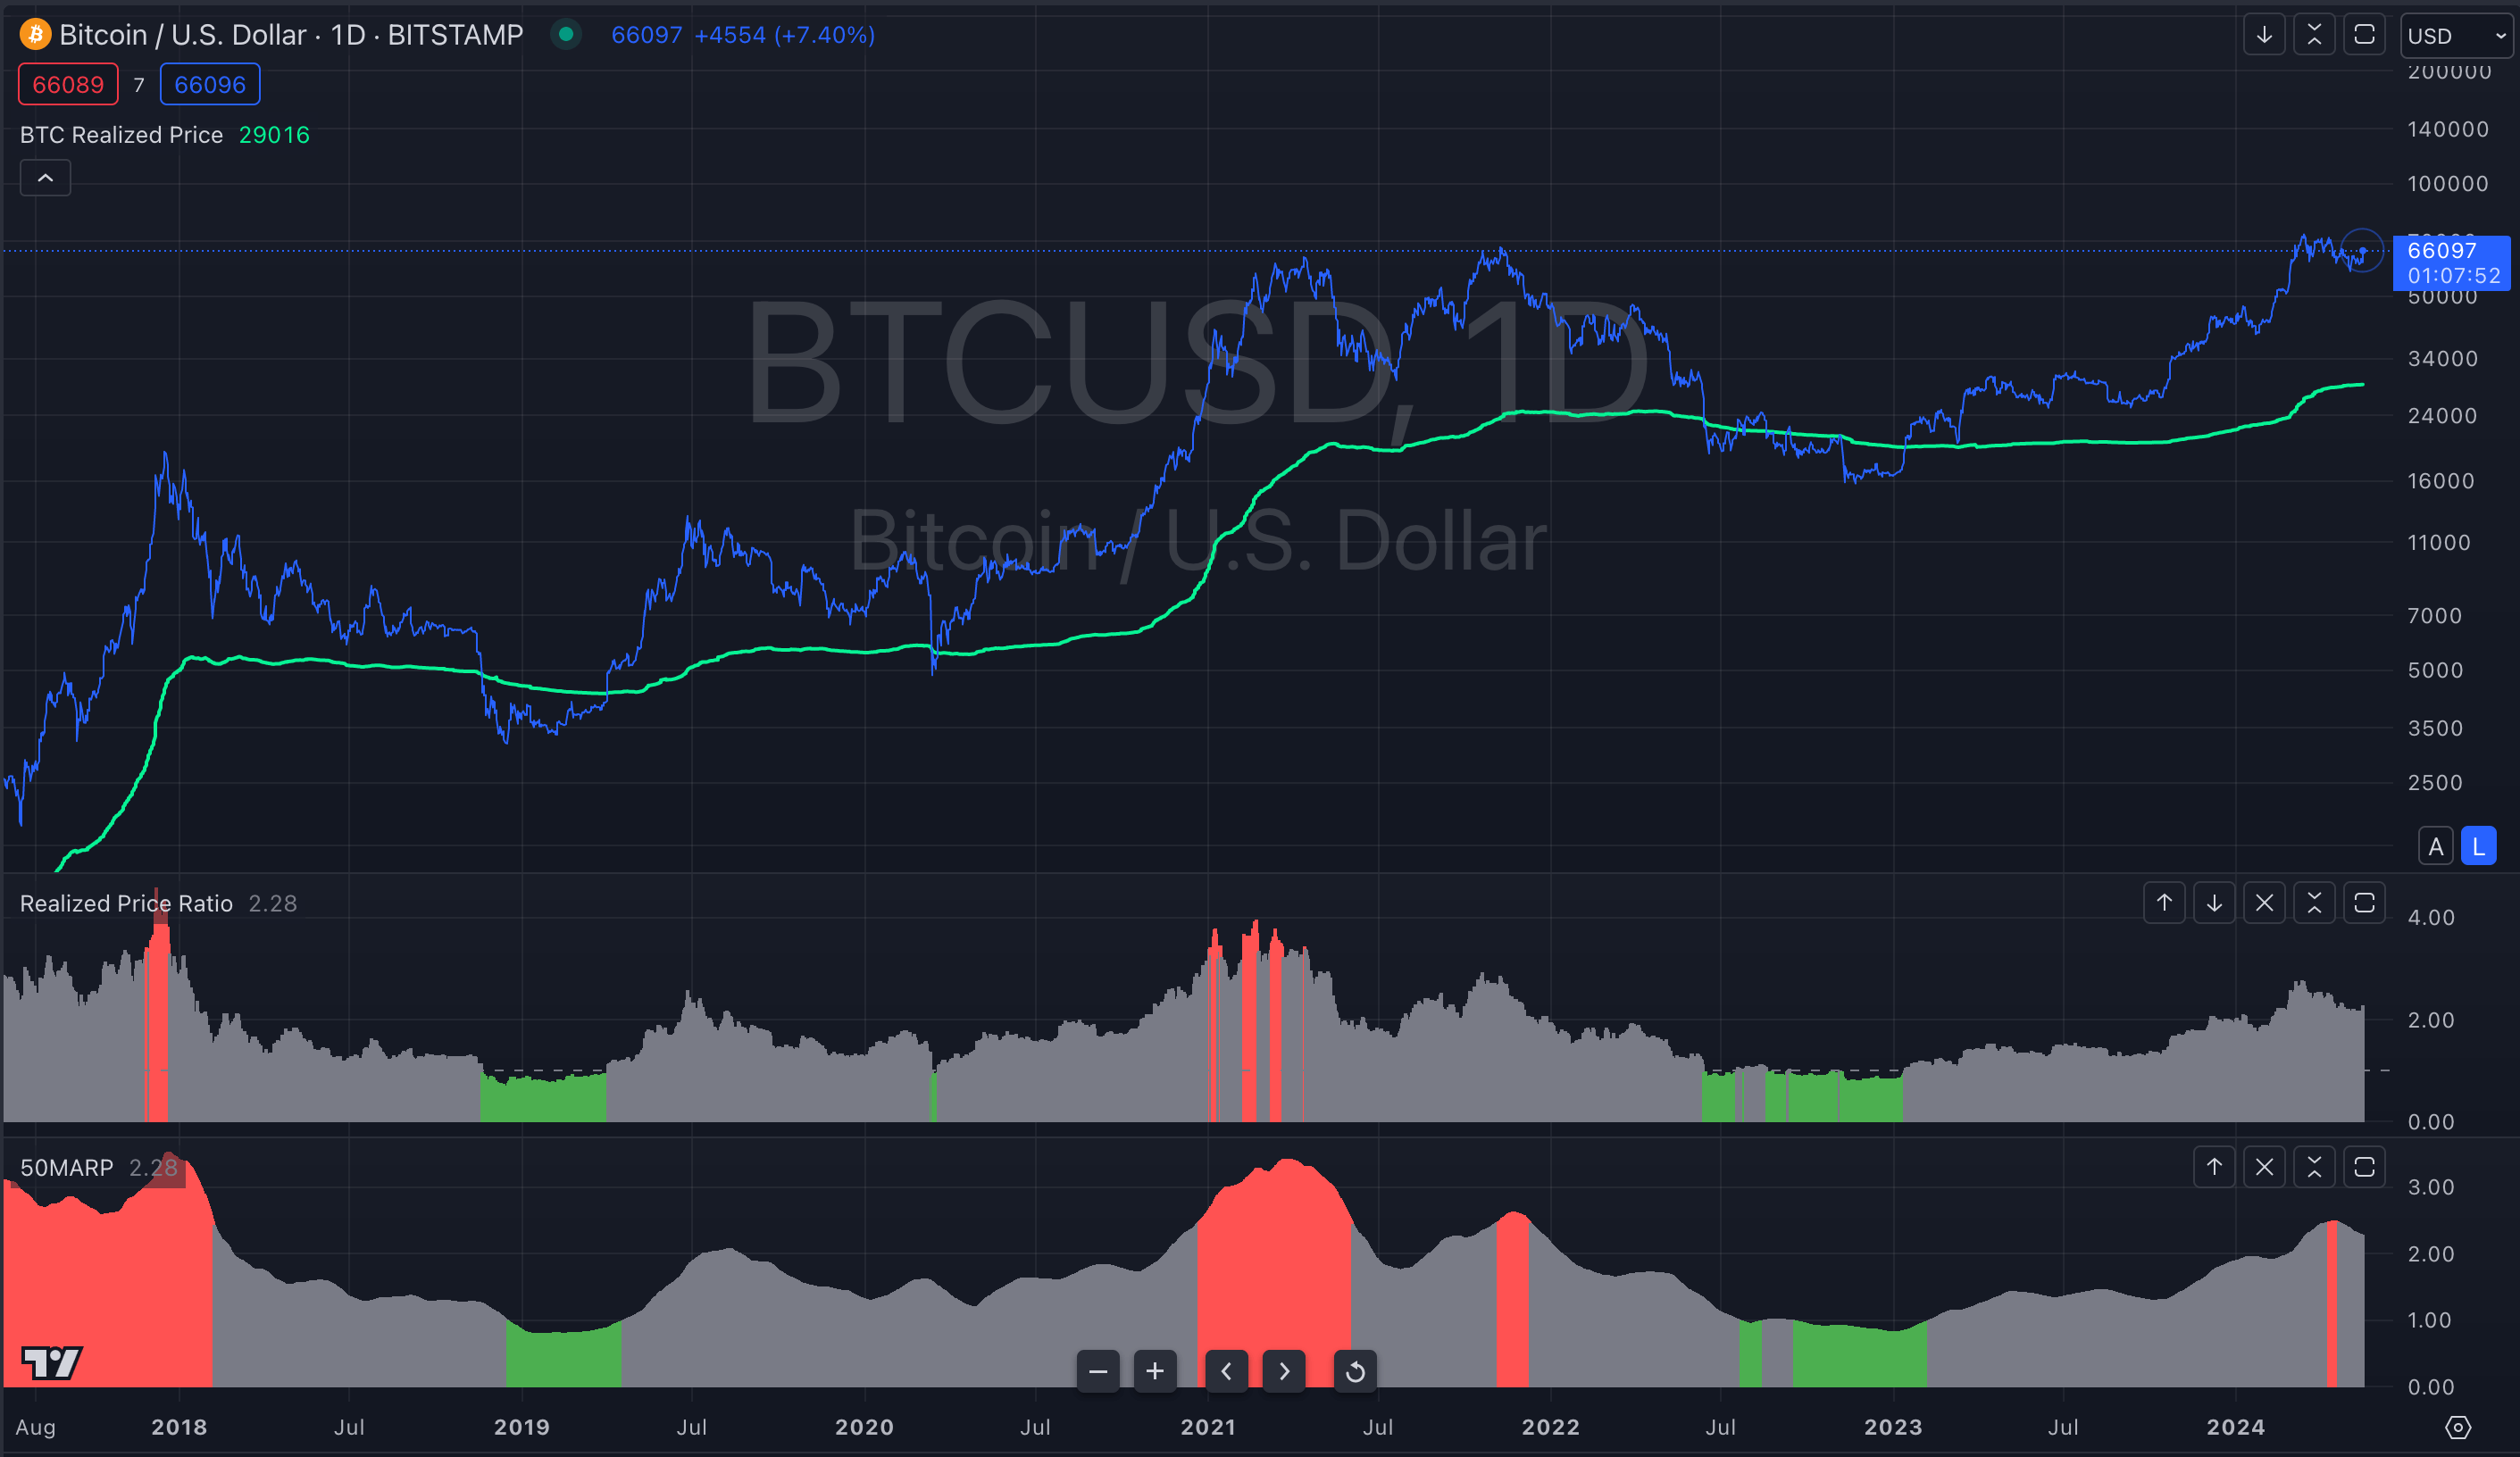
Realized Price
Realized price (RP), divergence and 50MARP.
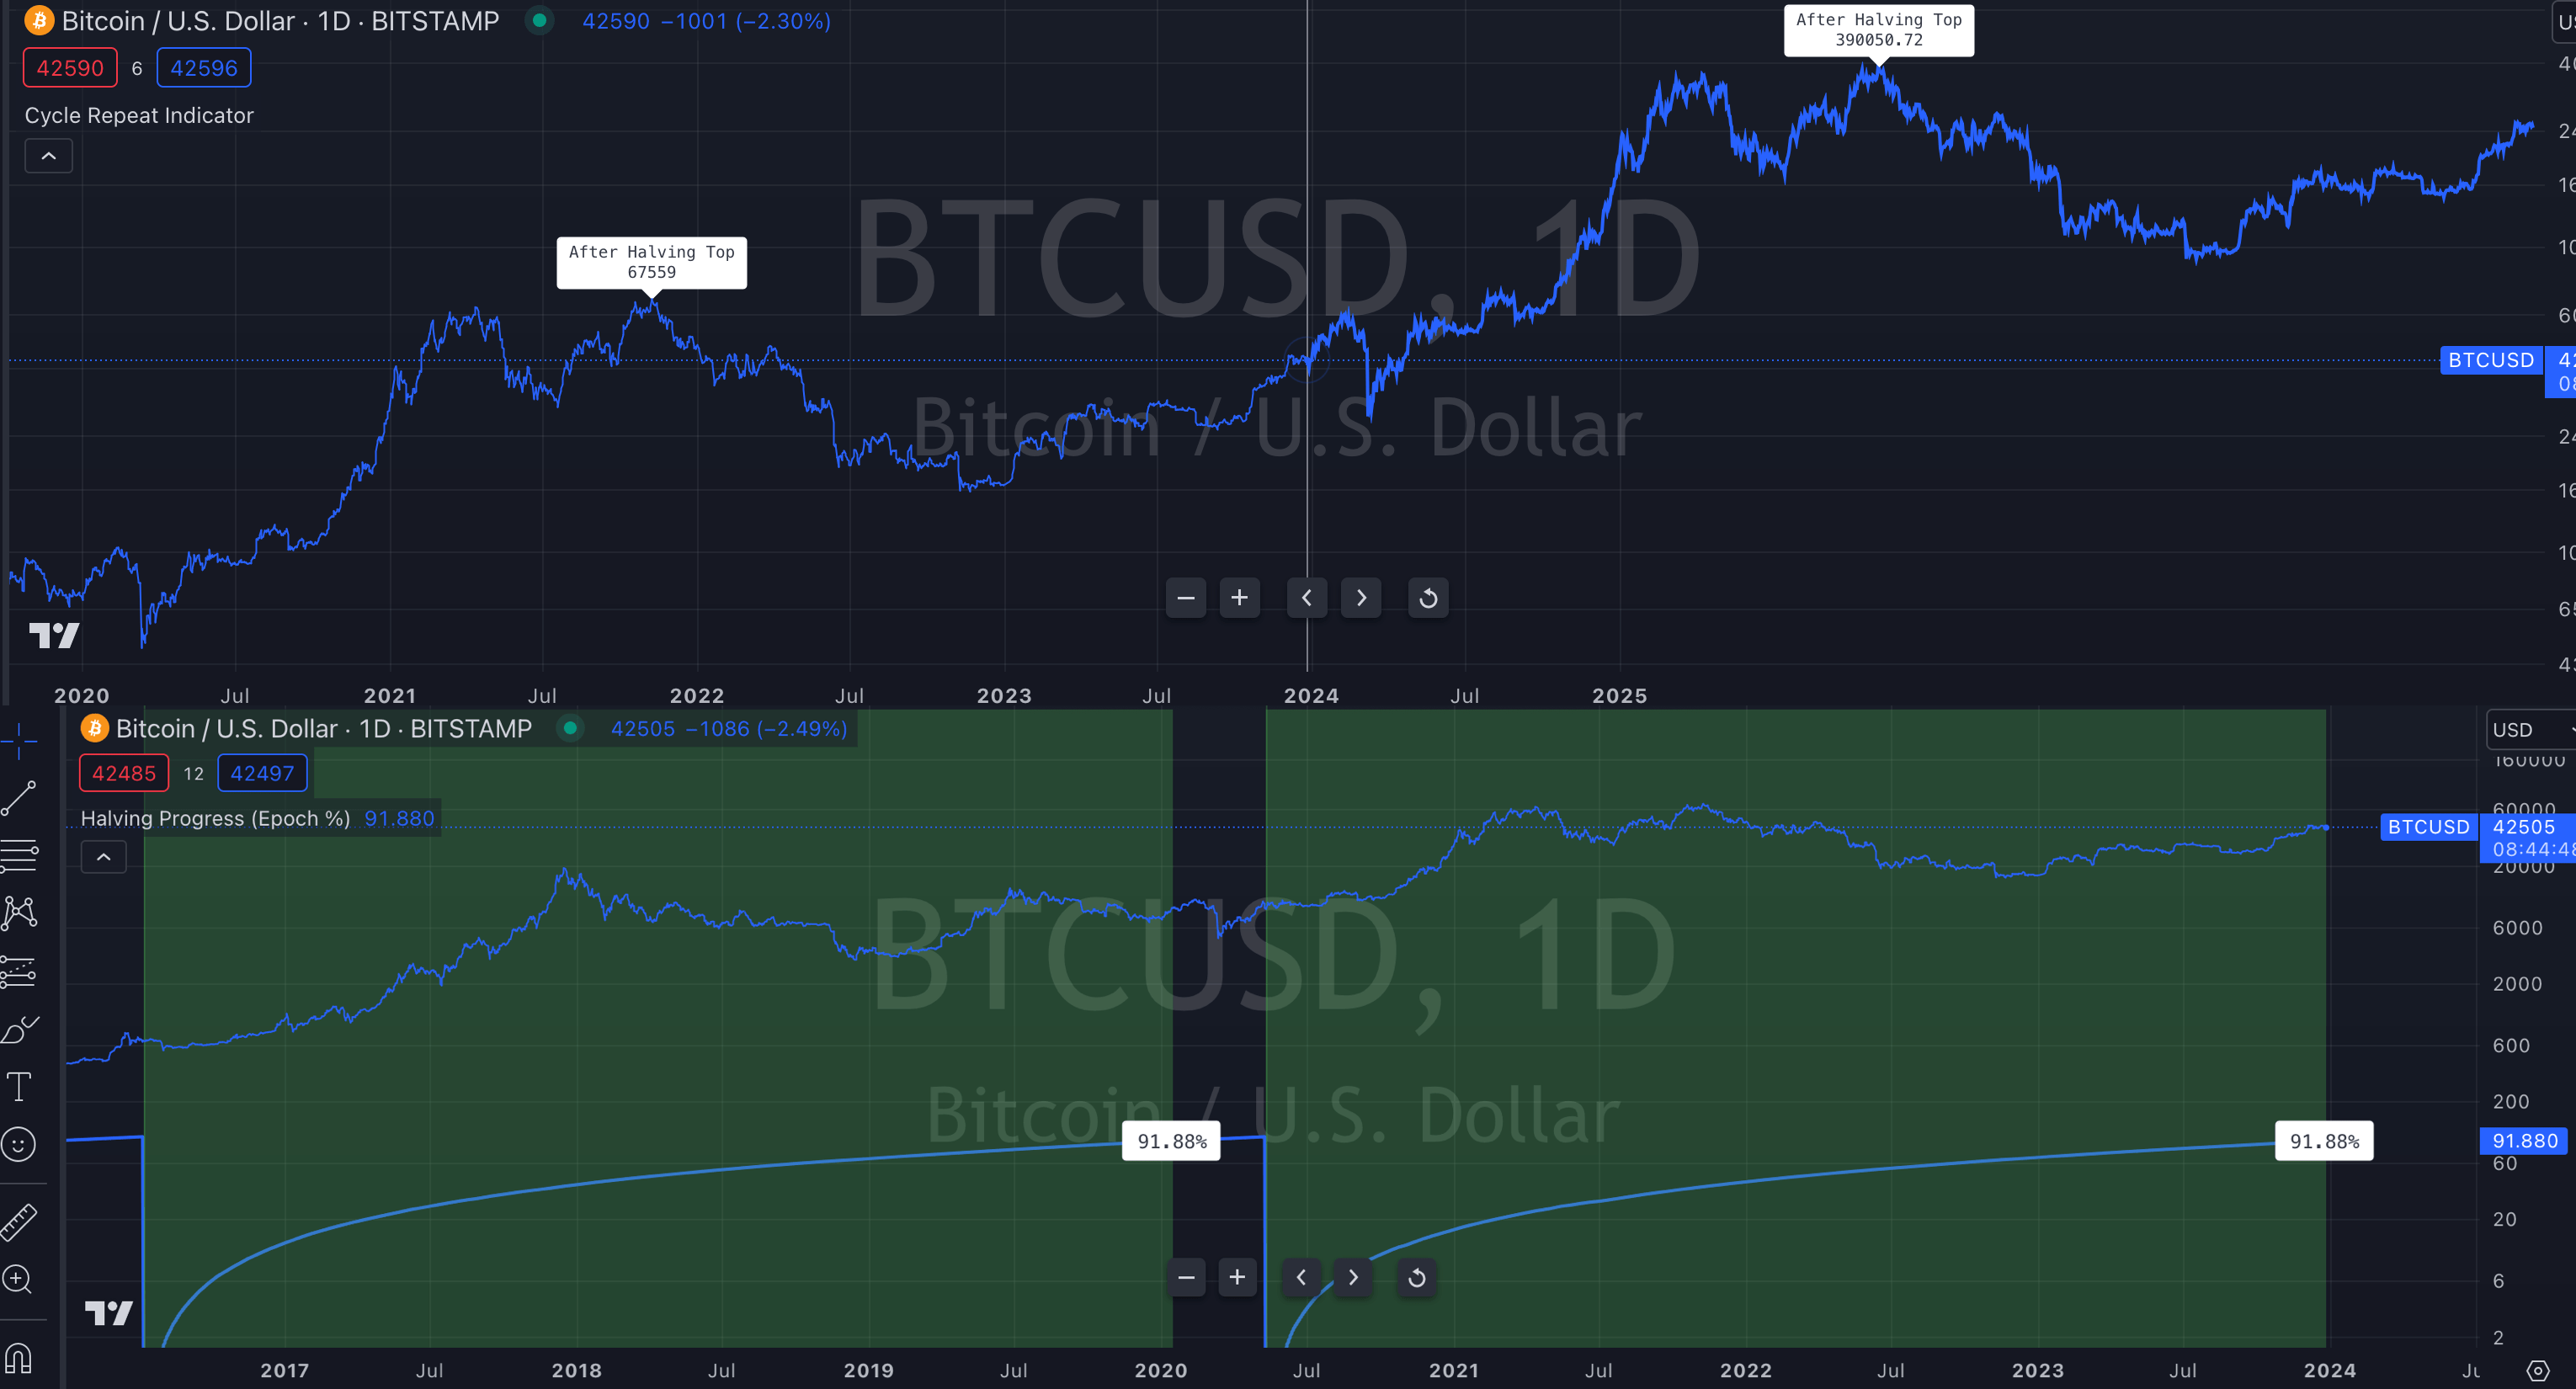
Cycle Charts
Cycle repeat and halving progress.
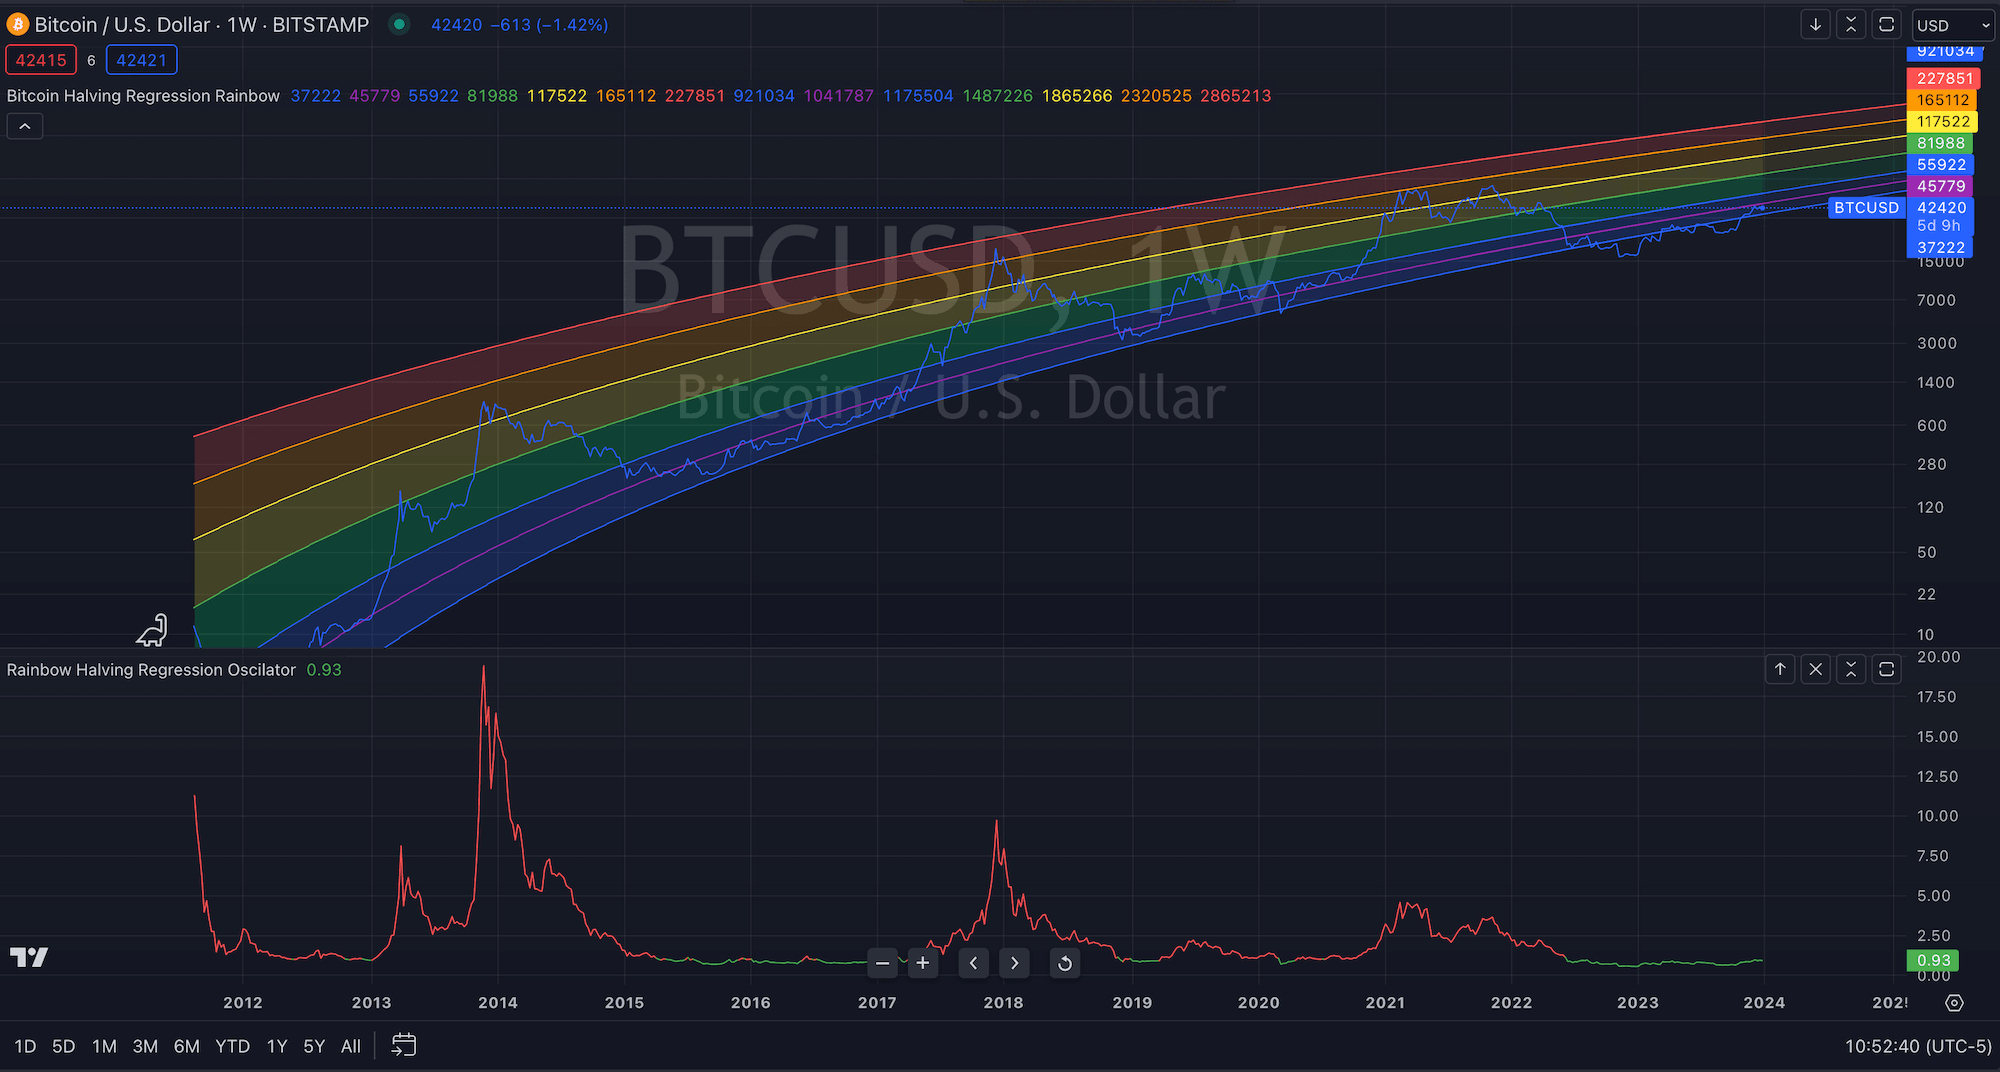
Rainbow
Rainbow halving regression and price vs Rainbow regression price.
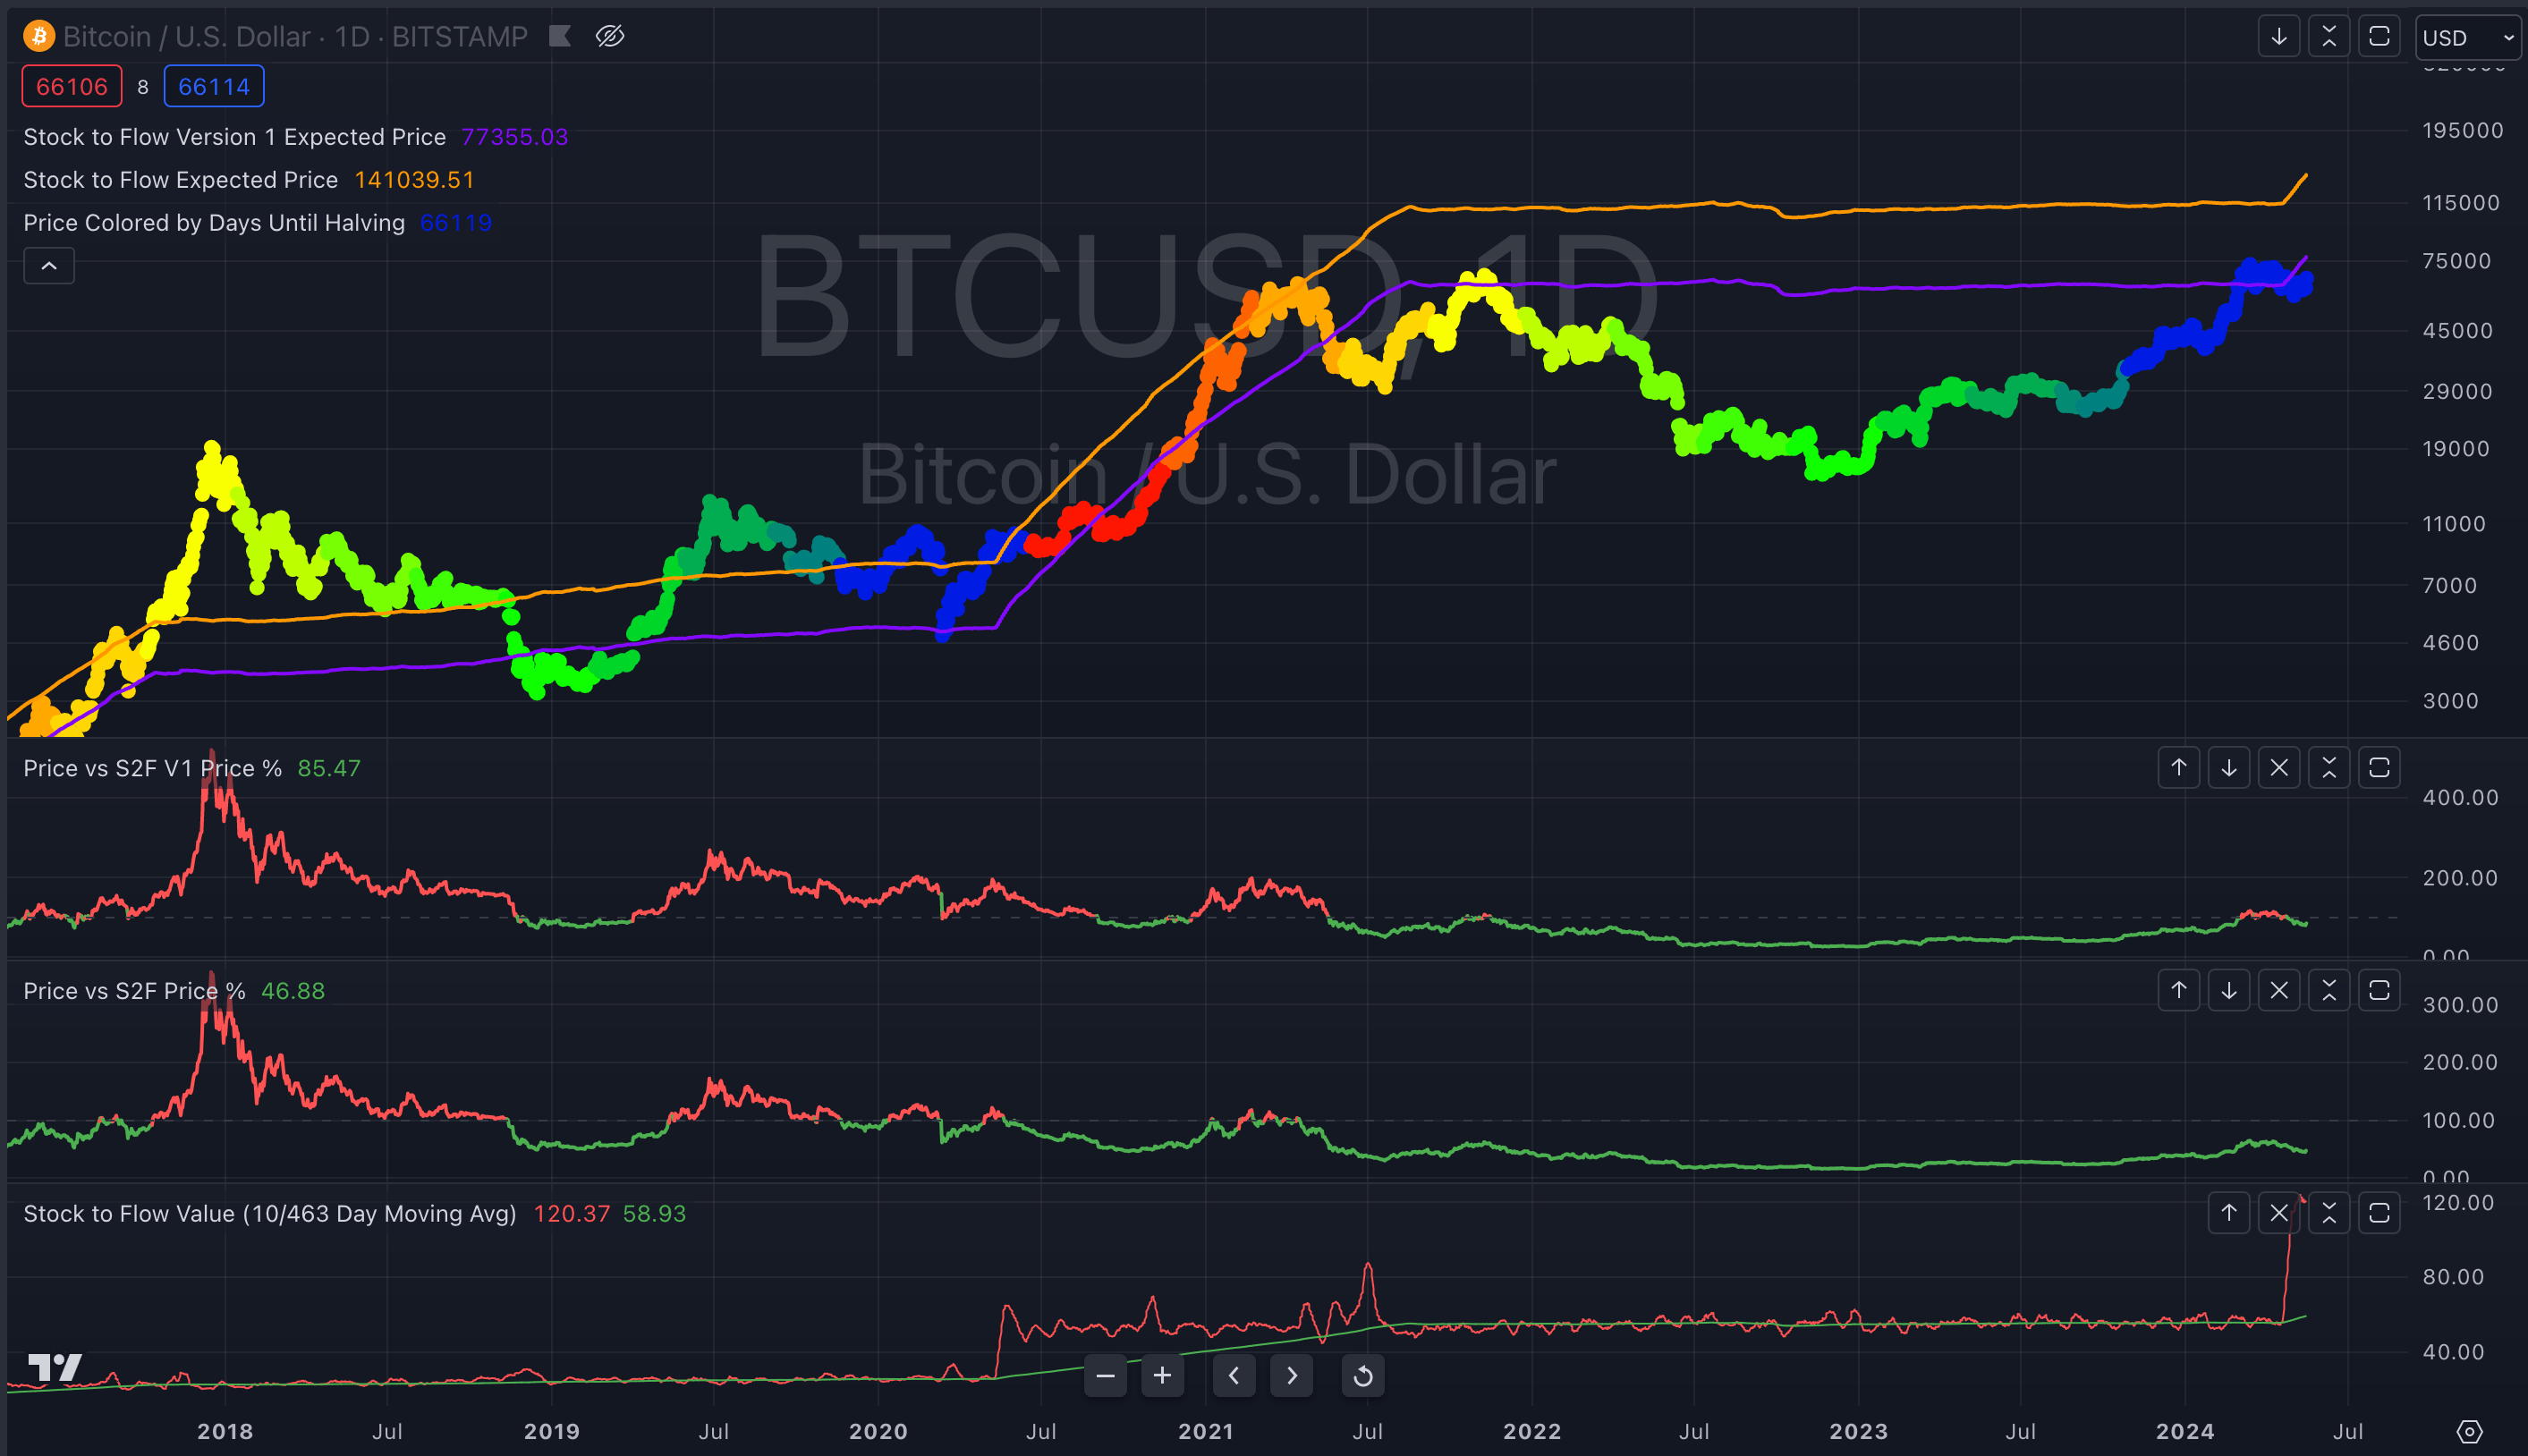
Stock to Flow
Stock to flow price, value and divergence.
Power Law
Power law and price vs power law expected price.
Realized Price
Realized price (RP), divergence and 50MARP (50-Day MA/50-Day RP MA.
Cycle Charts
Cycle repeat and halving progress.
Rainbow
Rainbow halving regression and price vs Rainbow regression price.


×
Bitbo's charts section offers a wide range of Bitcoin charts and metrics.
If you have any questions, comments, or feedback please reach out to us via Twitter or via email at info@bitbo.io.
@
BitboBTC