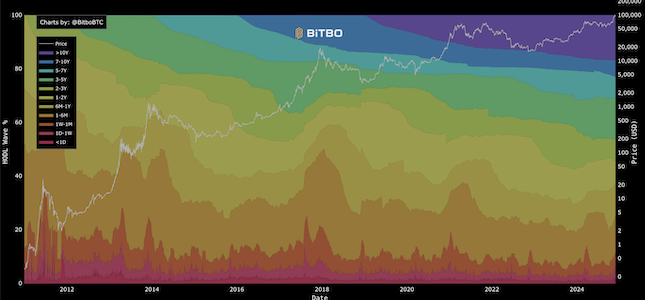
Bitcoin Rainbow Chart
A Bitcoin rainbow chart using only the halving dates as data.
Data & charts updated every hour
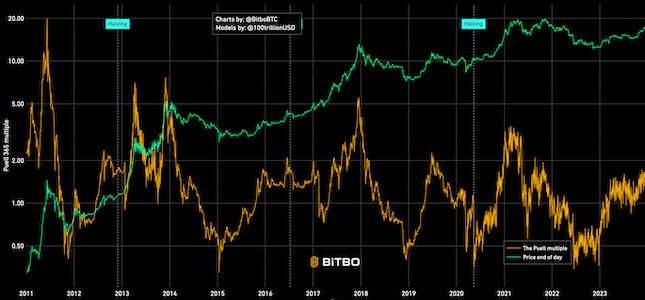
Block Subsidy Value: This shows how much each block's new Bitcoin is worth in USD. We calculate this by taking the number of new Bitcoin per block and multiplying it by Bitcoin's price on that specific day.
Subsidy in BTC: This tracks how many new Bitcoin miners get for solving each block. Every four years or so, this reward gets cut in half - it started at 50 BTC, then went to 25, then 12.5, then 6.25, and will keep halving into the future.
Bitbo's charts section offers a wide range of Bitcoin charts and metrics.
If you have any questions, comments, or feedback please reach out to us via Twitter or via email at info@bitbo.io.