


Realized Mayer Multiple
The ratio of Bitcoin's realized price to its 200-day realized price moving average.
Data & charts updated every hour
LTH realized price displays the average price at which long-term Bitcoin holders (LTH) acquired their coins. It specifically tracks "mature" coins that have remained unmoved for more than 155 days.
STH realized price displays the average price of coins that have moved on the Bitcoin network within the past 155 days.
Realized price represents the aggregate Realized Price of the entire network. This is calculated by dividing the Realized Cap by the total supply, showing the average price at which every coin last moved.
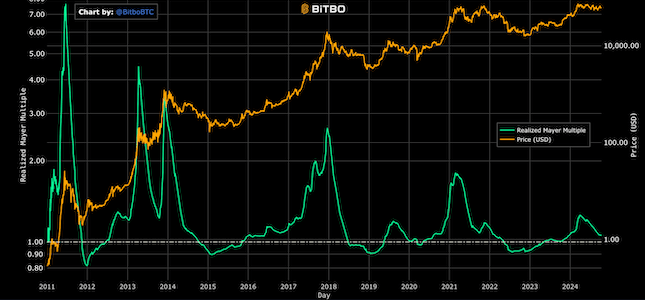
The ratio of Bitcoin's realized price to its 200-day realized price moving average.
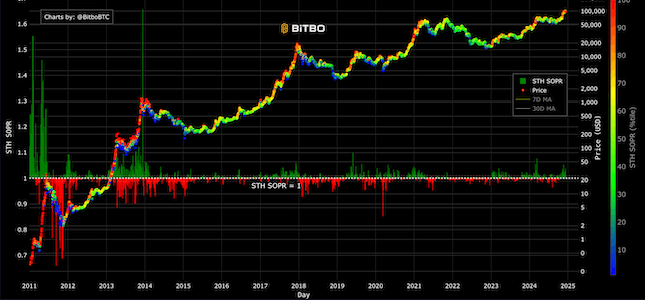
Shows whether Bitcoin is being sold at profit or loss by short-term holders.
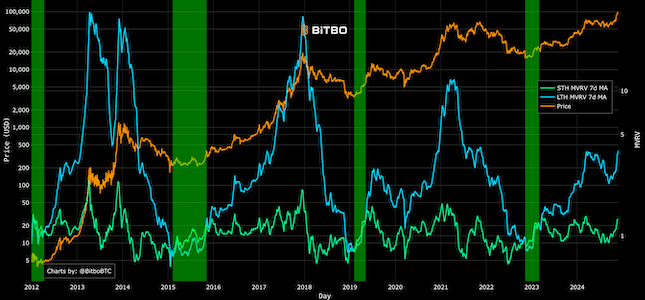
Shows LTH MVRV crossing below STH MVRV, indicating market cycle transitions.
Bitbo's charts section offers a wide range of Bitcoin charts and metrics.
If you have any questions, comments, or feedback please reach out to us via Twitter or via email at info@bitbo.io.