Long Term Power Law
Bitcoin's natural long-term power-law corridor of growth.
Data & charts updated every hour
This chart is inspired by @Giovann35084111's post on twitter.
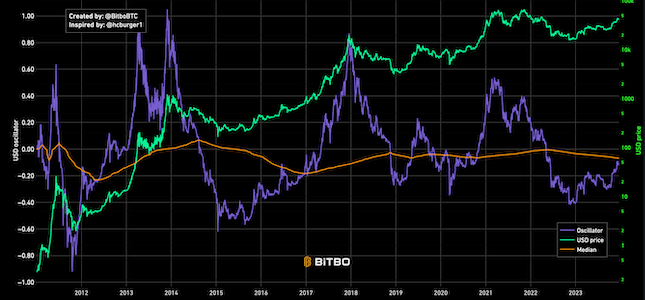
This chart shows the power law regression line and 4 year moving average of Bitcoin price.
The 4 year moving average of price follows the power law support line quite closely, with an correlation coefficient nearing .98.
Bitbo's charts section offers a wide range of Bitcoin charts and metrics.
If you have any questions, comments, or feedback please reach out to us via Twitter or via email at info@bitbo.io.