


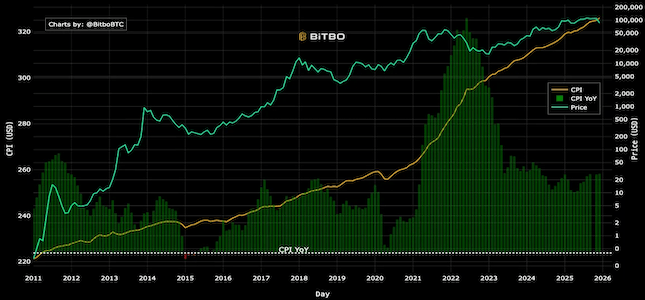
U.S. CPI vs Bitcoin
Compares U.S. Consumer Price Index with Bitcoin price.
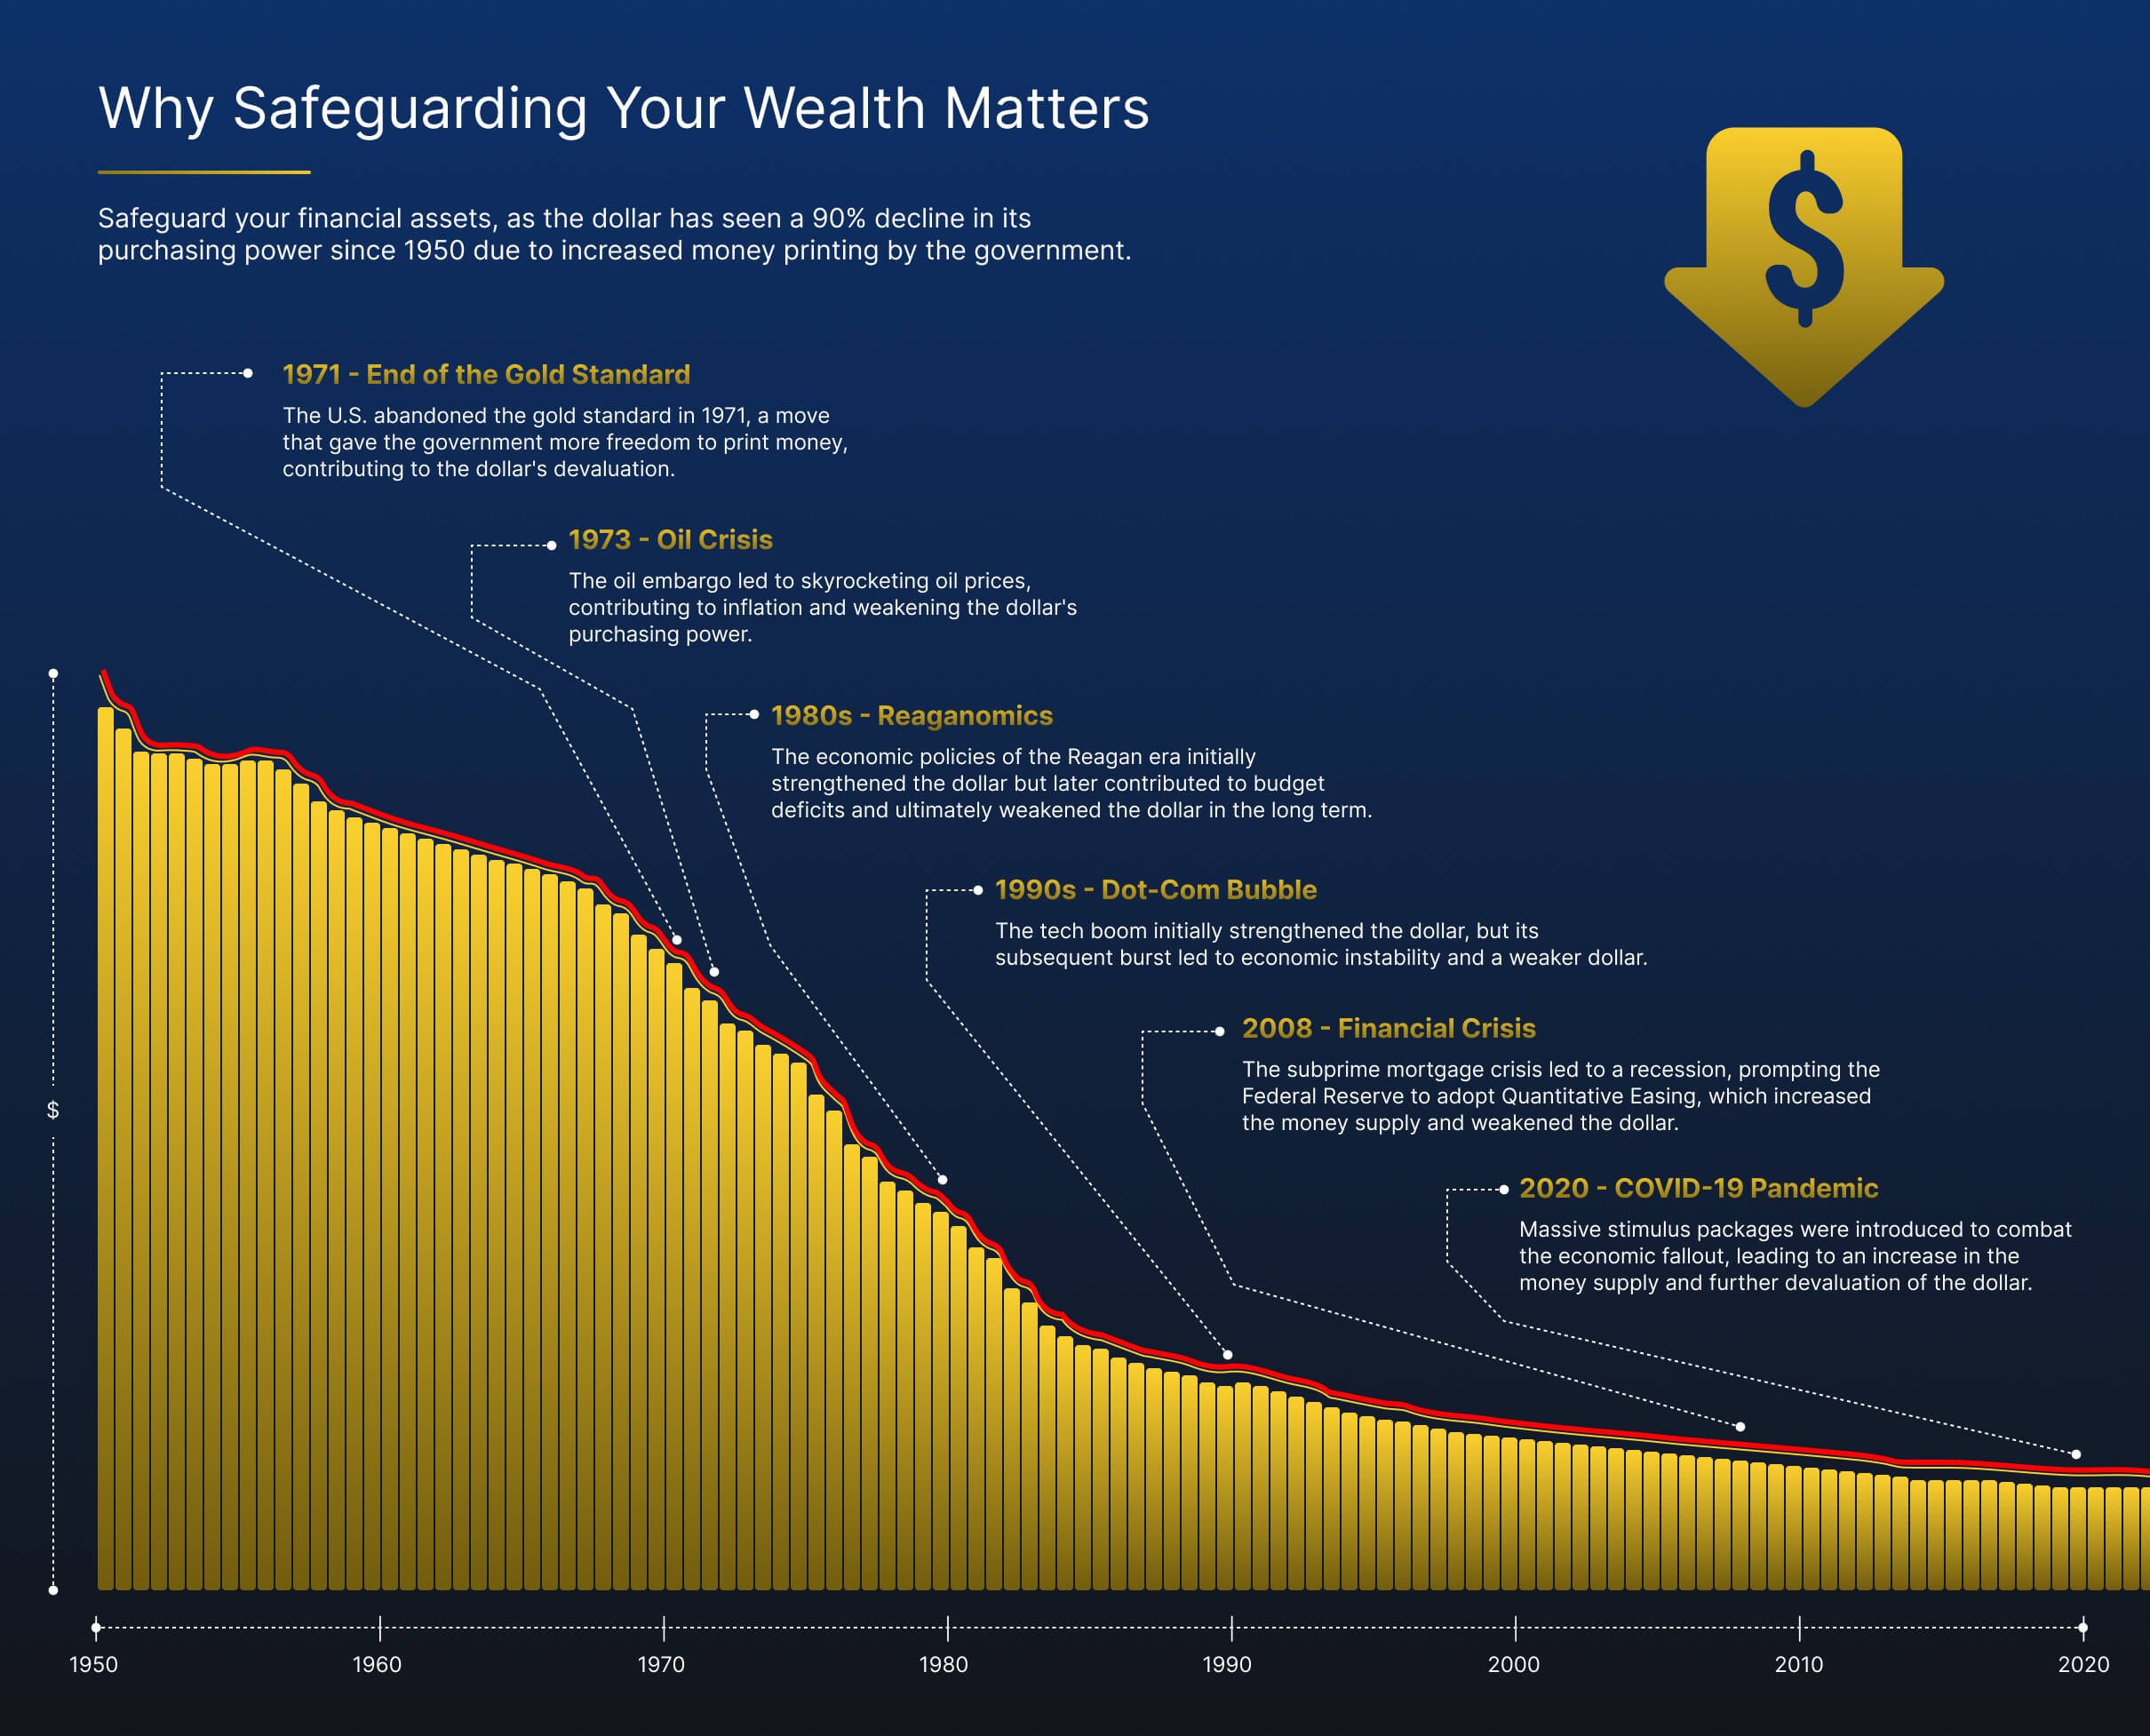
This chart shows the US dollar devaluation as a percentage of the maximum CPI in FRED data.
The Dollar Devaluation % is the current CPI divided by the historical maximum CPI to find the percentage of devaluation from the peak of the dollar's value.
Data is sourced from FRED Consumer Price Index for All Urban Consumers data.
The graph above shows the purchasing power of the US dollar since 1913. 1913 is when the Federal Reserve, which is actually a privately-owned central bank, took over the US banking system.
As you can see, it's been pretty much downhill since the Fed took over. In fact, the dollar has lost over 96% of its value.
That means today's dollar would be worth less than 4 cents back in 1913. How much longer will the dollar maintain its reserve-currency status at this rate?
By printing more money.
Printing more money causes monetary inflation. That means there are more dollars in circulation, but just because there is more paper money floating around, that doesn't mean value has been created.
The chart below shows the history of the dollar inflation.
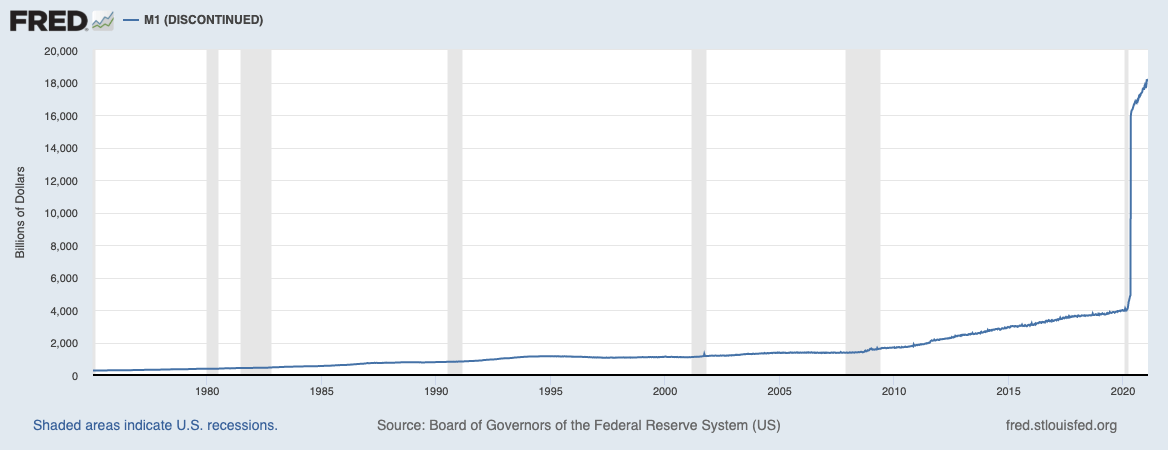
All you really get is price inflation. Here's an extreme example: Let's say the Federal Reserve just gave everyone in America $1 million.
Wouldn't that be great if everyone in America became a millionaire overnight? Unfortunately, nothing would change, except prices would increase.
Think about it. How much would you have to pay the plumber to come to your house, if he's already a millionaire?
On August 15, 1971, President Richard Nixon "temporarily" suspended the Gold standard - the rule that $35 could be redeemed for an ounce of Gold.
Thus every dollar printed by the US government would need to be backed by real gold held in the custody of the government.
This prevented the government from printing as many dollars as they wanted, and thereby decrease the purchasing power of the dollar.
Once the Gold standard was severed, inflation skyrocketed, as seen in the chart above.
Unlike paper money dollars, which can be printed out of thin air, gold does not lose value.
In fact, gold doesn't really go up or down. When gold goes up, it really means the dollar is going down and when gold goes down, it's actually the dollar getting stronger (increasing its purchasing power).
So by keeping a portion of your savings in gold, you offset the losses of your dollar being devalued.
When you buy gold, silver or other commodities that resist inflation, it's called a hedge against inflation.
Compares U.S. Consumer Price Index with Bitcoin price.
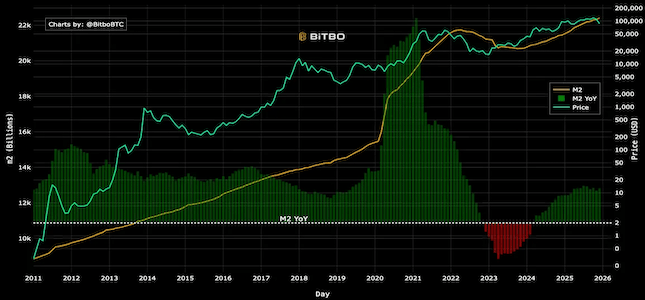
Compares U.S. M2 money supply with Bitcoin price.
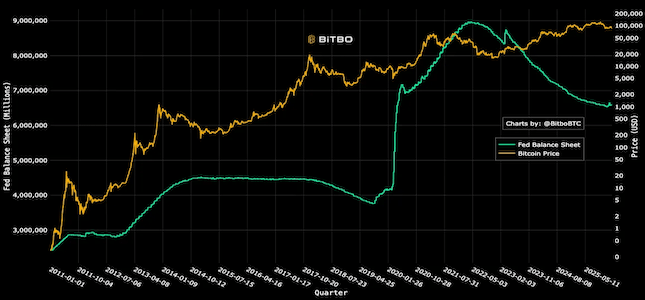
Compares the Federal Reserve balance sheet with Bitcoin price.
Bitbo's charts section offers a wide range of Bitcoin charts and metrics.
If you have any questions, comments, or feedback please reach out to us via Twitter or via email at info@bitbo.io.