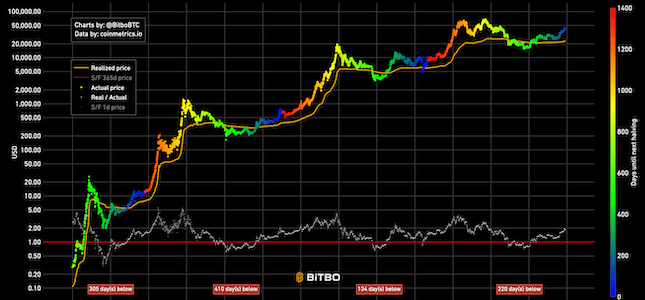
Realized Price
Realized price is the realized market cap divided by total amount of generated coins.
Data & charts updated every hour
This chart displays the short term holder realized price (STH price).
It is the average price at which coins have moved on the Bitcoin network over the past 155 days.
Unlike long-term holders, STHs are more sensitive to price fluctuations and often seek to capitalize on short-term market movements.
This metric is crucial in understanding market sentiment, as STHs are typically quicker to sell during volatile periods.
Historically, when the market price of Bitcoin is above the STH Realized Price, it indicates a bullish market, as short-term holders are in profit.
Conversely, when the market price falls below the STH Realized Price, it signals a bearish trend, with holders more likely to incur losses.
The STH Realized Price chart helps identify potential resistance levels and selling pressure, offering insights into the behavior of newer market participants and the broader market dynamics.
Bitbo's charts section offers a wide range of Bitcoin charts and metrics.
If you have any questions, comments, or feedback please reach out to us via Twitter or via email at info@bitbo.io.