


Bitcoin Rainbow Chart
A Bitcoin rainbow chart using only the halving dates as data.
Data & charts updated every hour
The Mayer Multiple is used for technical analysis in Bitcoin investing.
It is used in order to determine whether Bitcoin is overbought, fairly priced, or undervalued.
The Mayer Multiple is calculated by taking the price of Bitcoin and dividing it by the 200 day moving average value.
So, take for example a Bitcoin price of $10,890 and a 200 day moving average of $9,287.
The Mayer multiple was created to determine when a bubble in Bitcoin is occurring or, conversely, when Bitcoin is underbought and undervalued. When Trace Mayer came up with the multiple, he found that by back-testing various multiples, 2.4 performed the best.
That is, if a Bitcoin investor bought Bitcoin at any multiple below 2.4 and stopped investing once the multiple reached 2.4, it yielded the best results. The thesis here is that once the multiple goes above 2.4, it indicates that Bitcoin may be overbought and a mania (usually with altcoin mania too) has set in, which could result in a bubble.
This is where the Mayer Multiple breaks from traditional technical analysis. Growing prices are typically considered bullish, whereas dropping prices are considered bearish. The Mayer Multiple takes the opposite approach by trying to identify a fault line in a burgeoning bubble so the investor can stop accumulating Bitcoin before a top hits.
NOTE: Identifying bubbles is merely the intended purpose of the Mayer Multiple. It should be made clear that expecting past performance to hold consistent for future performance is not guaranteed. Just because a multiple of 2.4 has historically performed well doesn't mean this will continue to be true. Predicting the future of markets is impossible so you should proceed with any investment thesis or technical analysis with caution.
Trace Mayer is one of Bitcoin's earliest investors and a student of Austria economic theory. He was one of the leaders behind the Proof of Keys movement, which seeks to hold Bitcoin exchanges accountable by creating a regularly scheduled "run on the banks" in order to make sure exchanges are not participating in fractional reserve banking practices, especially with lending becoming more popular.

A Bitcoin rainbow chart using only the halving dates as data.

A sentiment analysis tool for Bitcoin and crypto markets, indicating when markets are overly fearful or greedy.
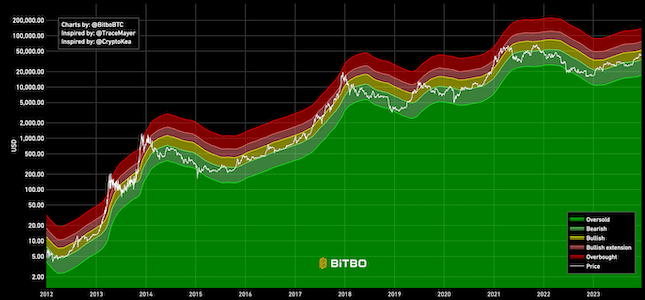
The Mayer Multiple Price Bands chart is a simple modification to the original Mayer Multiple.
Bitbo's charts section offers a wide range of Bitcoin charts and metrics.
If you have any questions, comments, or feedback please reach out to us via Twitter or via email at info@bitbo.io.