


RSI
The Relative Strength Index (RSI) is a momentum based visualization.
Data & charts updated every hour
The 300-week moving average (MA) has emerged as a valuable tool. This long-term indicator provides insights into Bitcoin's historical price behavior and potential support levels and has rarely been broken.
### Why Use the 300-Week MA?
The Relative Strength Index (RSI) is a momentum based visualization.
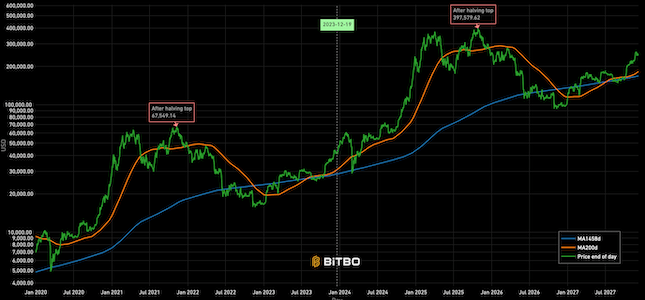
Projection of Bitcoin's price from today's price based on a repeat of previous cycle.

A Bitcoin rainbow chart using only the halving dates as data.
Bitbo's charts section offers a wide range of Bitcoin charts and metrics.
If you have any questions, comments, or feedback please reach out to us via Twitter or via email at info@bitbo.io.