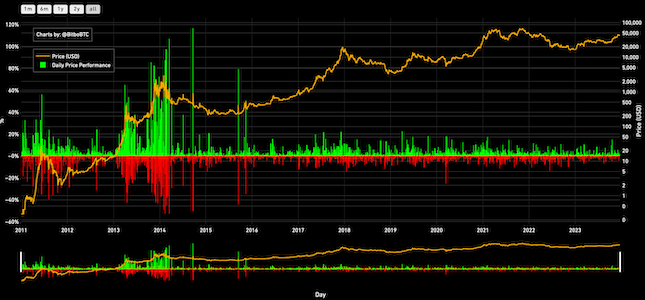
Bitcoin Daily Price Performance
Shows Bitcoin's entire price history. Daily change in price is shown in red/green under the chart.
Data & charts updated every hour
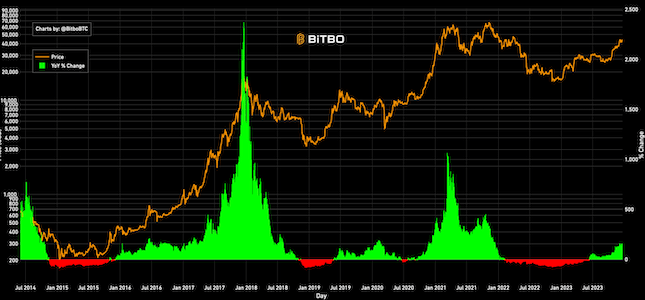
This heatmap visualizes Bitcoin's percentage price change for each three-month quarter of the year. It helps identify seasonal trends and cyclical market behavior over the years.
Bitbo's charts section offers a wide range of Bitcoin charts and metrics.
If you have any questions, comments, or feedback please reach out to us via Twitter or via email at info@bitbo.io.