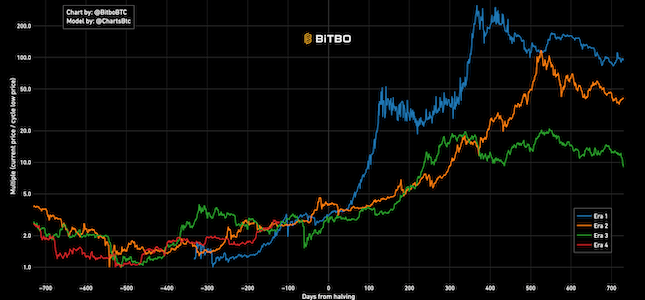
Cycle Low Multiple
Divides the bitcoin price history into eras. Each era represents the days within a block reward subsidy period.
See if your Bitcoin holdings and recurring contributions are on track to reach your retirement goal, based on an expected annual growth rate.
Your starting position
$0.00 monthly
At 10.0% annual growth
This calculator projects your Bitcoin holdings using your expected Compound Annual Growth Rate (CAGR) and optional Dollar-Cost Averaging (DCA) contributions to show whether you are on pace to reach your retirement goal by your target year.
The calculator compounds the BTC price each year using your expected CAGR, applies any recurring DCA contributions, and tracks the impact on your portfolio:
1. Amount of BTC: The amount of Bitcoin you currently hold
2. Current BTC Price: The current Bitcoin price (defaults to live price, but can be customized)
3. Retirement Goal: Your target USD amount for retirement
4. Years to Retirement: How many years until you want to reach your goal
5. Expected CAGR: The annualized return you believe Bitcoin can achieve
6. DCA Contribution & Frequency: The amount you plan to invest each period and how often you invest
The chart shows year-by-year projections displaying:
Note: This calculator assumes you hold a fixed amount of Bitcoin in addition to any DCA contributions. The expected CAGR and DCA plan are your own assumptions and may not be achievable depending on market conditions.
Divides the bitcoin price history into eras. Each era represents the days within a block reward subsidy period.

Bitcoin's natural long-term power-law corridor of growth.

A Bitcoin rainbow chart using only the halving dates as data.


