


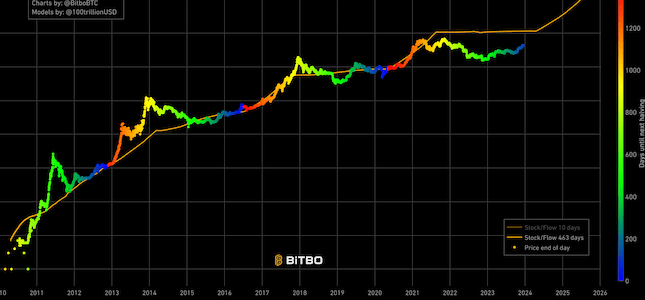
Stock to Flow
Shows the projected Bitcoin price based on the stock to flow model.
Data & charts updated every hour
|
|
Current S/F (463D)
Current Model Price (463D) in USD
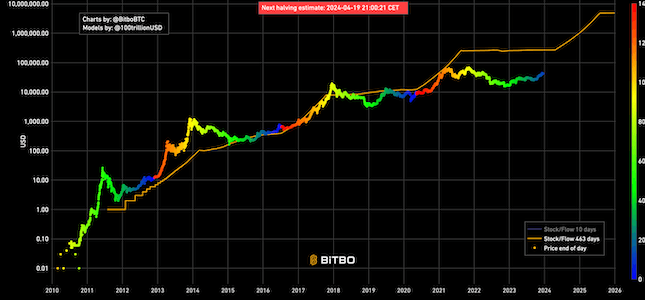
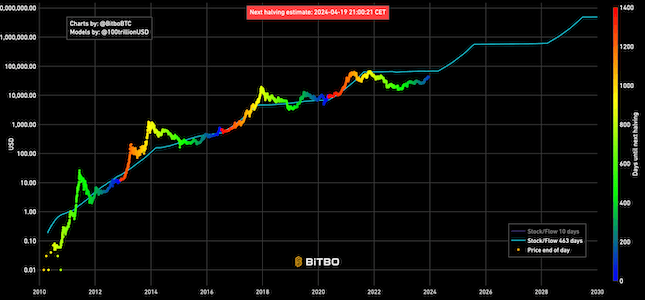
Next halving estimate
The BTC vs Gold chart is a very simple chart. Instead of a standard stock to flow chart valued in dollars, it is instead valued in ounces of gold.
The idea behind this chart is to compare bitcoins stock to flow against a hard, finite asset like Gold instead of an inflationary, finite asset like dollars. Since Gold and BTC are more similar assets, we can get a better picture of bitcoins future as a store of value.
Shows the projected Bitcoin price based on the stock to flow model.
Shows the projected Bitcoin price based on the cross-asset version of the stock to flow model.
Shows the projected Bitcoin price based on version 1 of the stock to flow model.
Bitbo's charts section offers a wide range of Bitcoin charts and metrics.
If you have any questions, comments, or feedback please reach out to us via Twitter or via email at info@bitbo.io.