


Quarterly Price Performance
Quarterly returns of BTC. Yellow line is closing price at quarter end. Red and green lines show percent gain or loss.
Data & charts updated every hour
The Satoshi Per Dollar chart is very simple. It tells you how many satoshis a dollar would buy you on any given date in bitcoin’s history.
Take the price of bitcoin in dollars and divide it by 100,000,000 (the number of satoshis in a bitcoin). So if bitcoin is worth $30,000, divide it by 100,000,000. You would get $0.0003. This is what 1 satoshi is worth. So now divide 1 (representing $1) by the value of a single satoshi in dollars to get the number of satoshis that equal $1. $1 divided by $0.0003. And there we get 3,333.
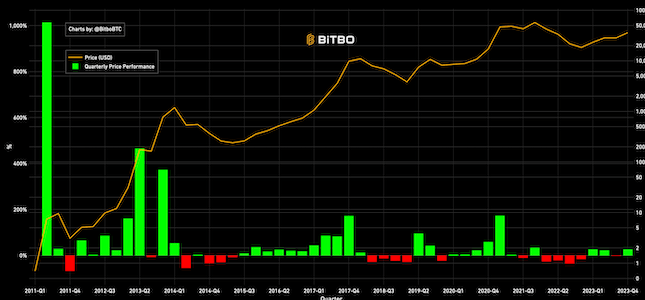
Quarterly returns of BTC. Yellow line is closing price at quarter end. Red and green lines show percent gain or loss.
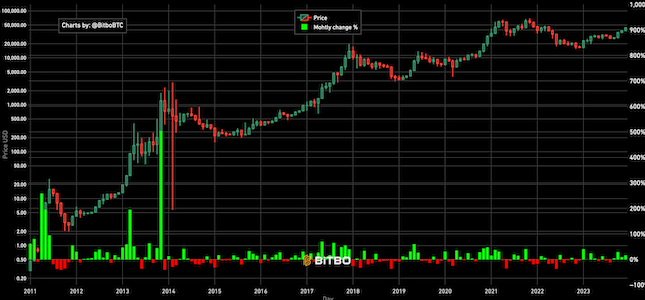
Shows Bitcoin's performance and returns each month compared to the previous month's price.
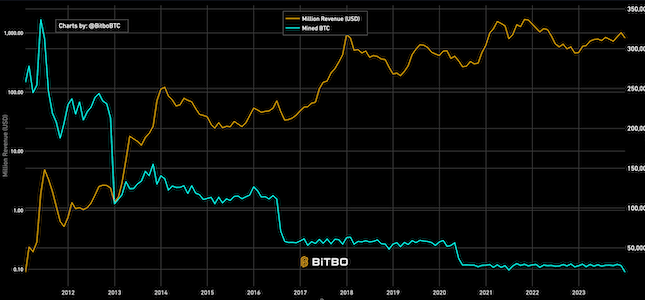
Shows the amount of revenue earned monthly by miners in USD and BTC.
Bitbo's charts section offers a wide range of Bitcoin charts and metrics.
If you have any questions, comments, or feedback please reach out to us via Twitter or via email at info@bitbo.io.