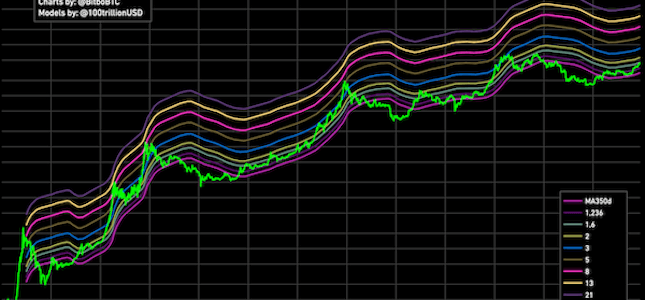
Bitcoin Rainbow Chart
A Bitcoin rainbow chart using only the halving dates as data.
Data & charts updated every hour
Average monthly Fear & Greed Index value. Color-coded from red (fear) to green (greed).
Past dates when the F&G Index was within ±3 of today's reading. Consecutive days at similar levels are grouped — only the last day before sentiment shifted is shown. Excludes the most recent 6 months so all return windows (30d, 90d, 180d) have time to play out.
| Date | F&G | BTC Price | 30d Later | 90d Later | 180d Later |
|---|
Average BTC return after each day in a given F&G zone over the last 3 years. Win Rate is the % of times BTC was higher 90 days later.
| Highest F&G Readings | ||||
|---|---|---|---|---|
| Date | F&G | BTC Price | 30d Later | 90d Later |
| Lowest F&G Readings | ||||
|---|---|---|---|---|
| Date | F&G | BTC Price | 30d Later | 90d Later |
Data from alternative.me
The Bitcoin Fear and Greed Index is a tool used to analyze market sentiment in the cryptocurrency space. It helps identify when the market is experiencing excessive fear, which might indicate undervaluation, or excessive greed, suggesting potential overvaluation.
The chart displays Bitcoin's price, highlighting its position on the fear and greed scale. Red and orange colors signify a more fearful market sentiment, while green indicates a more optimistic or bullish outlook.
This index measures investor sentiment in the crypto market using a combination of six indicators. It provides a score from 0 to 100, where lower scores reflect fear and higher scores indicate greed. This helps investors understand market trends and make better trading decisions.
Initially created by CNNMoney for the stock market, the Fear and Greed Index was adapted for cryptocurrencies by Alternative.me. It serves a similar purpose by evaluating market sentiment to determine whether conditions are bullish or bearish.
The crypto version of the index uses six key indicators:
The index ranges from 0 (extreme fear) to 100 (extreme greed). High values may suggest an overbought market, while low values could indicate oversold conditions, offering potential buying opportunities.
Investors use the index to guide their strategies. High scores might prompt caution or selling, while low scores could signal a good time to buy.
While useful, the index is based solely on sentiment and lacks technical or fundamental analysis. It should be used alongside other tools for a comprehensive market evaluation.