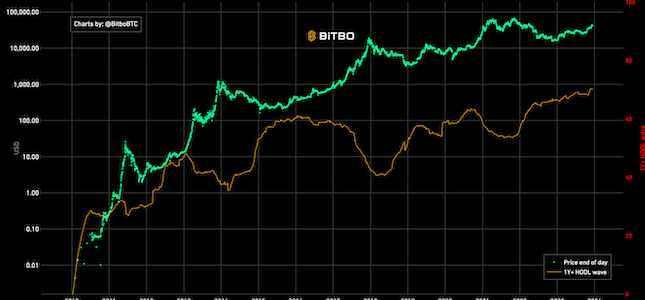
1-Year+ HODL
% of addresses that have not moved their bitcoins in more than 1 year.
Data & charts updated every block
This graph represents the coins minted (mined) in various time periods throughout the history of Bitcoin and how many of them are still in circulation today. In this case, circulation means the coins are still believed to be accessible (i.e. they have not been burned). For instance, on December 31 of 2018, there were 8,323,733 of year one Bitcoins still in circulation. As another example, on January 1 of 2014, there were 12,204,965 Bitcoins in circulation from the first 5 years of Bitcoin. The reason that the Y5 line is the same as the Y10 line is because the latter represents the first 10 years of Bitcoin’s existence. Since 2014 is the 5th year of Bitcoin, the Y10 line represents the exact same Bitcoins as Y5, but then begins to diverge as the 6th year begins and the Y10 line represents more Bitcoin.
We display the total number of mined coins within a time period and subtract the number of coins from that group that are believed to be burned.
Bitbo's charts section offers a wide range of Bitcoin charts and metrics.
If you have any questions, comments, or feedback please reach out to us via Twitter or via email at info@bitbo.io.