


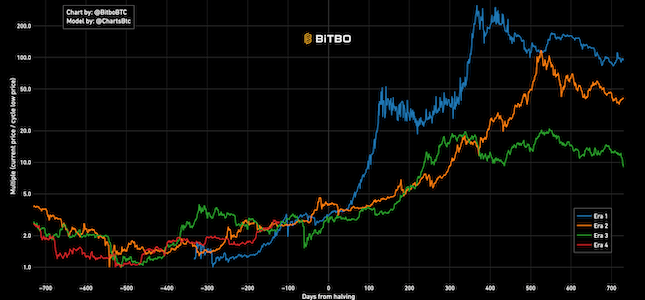
Cycle Low Multiple
Divides the bitcoin price history into eras. Each era represents the days within a block reward subsidy period.
Data & charts updated every hour
|
|
This chart shows the amount of Bitcoin that has moved at different price levels.
You can adjust the bucket size to group movements into larger or smaller price ranges.
The "Show First Bucket" option allows you to include or exclude movements at price zero, which typically represents mining rewards and other special transactions.
Divides the bitcoin price history into eras. Each era represents the days within a block reward subsidy period.

Bitcoin's natural long-term power-law corridor of growth.

A Bitcoin rainbow chart using only the halving dates as data.
Bitbo's charts section offers a wide range of Bitcoin charts and metrics.
If you have any questions, comments, or feedback please reach out to us via Twitter or via email at info@bitbo.io.