


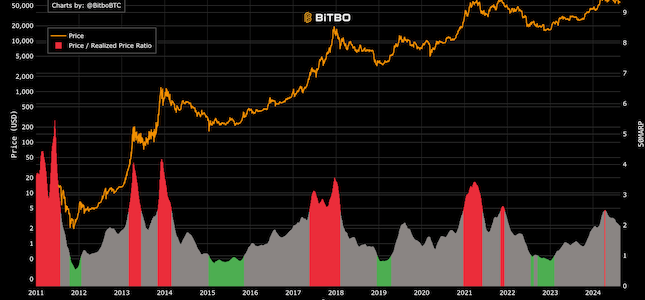
50MARP
Comparison of the 50-day realized price moving average vs a 50-day moving average of price.
Upgrade to Bitbo Pro to view this chart.
UpgradeStock to flow is a model that attempts to predict the price of Bitcoin based on the supply of new Bitcoin. Originally created by PlanB.
RSI is an indicator that measures the speed and change of price movements. It is calculated using the closing prices of an asset over time. In our case we use monthly RSI.
This is the simple moving average of the price of Bitcoin over a period of 1400 days (200 weeks).
The 2 year realized price tracks the average price that each Bitcoin has been moved at over the past 2 years.
Comparison of the 50-day realized price moving average vs a 50-day moving average of price.
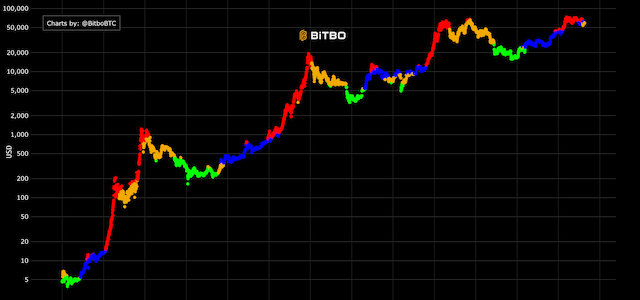
Attempts to pinpoint Bitcoin's cycles based on on-chain data.
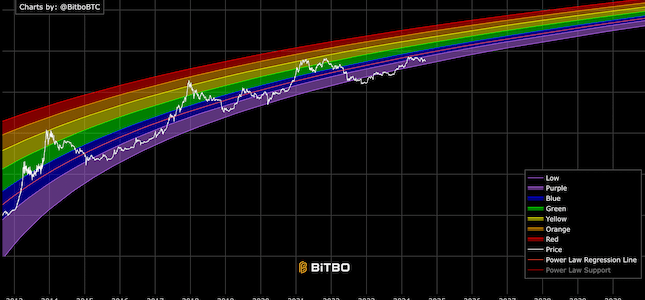
A rainbow chart based on the Bitcoin power law and time.
Bitbo's charts section offers a wide range of Bitcoin charts and metrics.
If you have any questions, comments, or feedback please reach out to us via Twitter or via email at info@bitbo.io.