


50MARP
Comparison of the 50-day realized price moving average vs a 50-day moving average of price.
Data & charts updated every hour
Bitcoin's history is divided into eras by halving events:
This chart shows Bitcoin's recent price history alongside four future projections. Each projection takes the first 1,458 days of a past era's price behavior and repeats it forward from today. The four scenarios are:
By overlaying all four scenarios on a single chart, you can compare how each past era suggests Bitcoin might perform over the next cycle. The projected top for each scenario is marked on the chart.
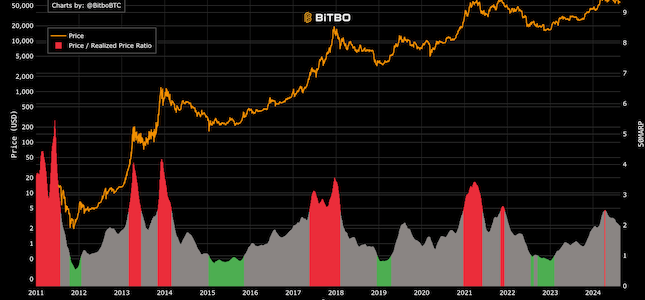
Comparison of the 50-day realized price moving average vs a 50-day moving average of price.
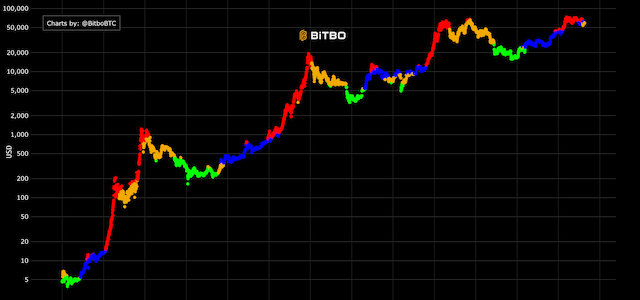
Attempts to pinpoint Bitcoin's cycles based on on-chain data.
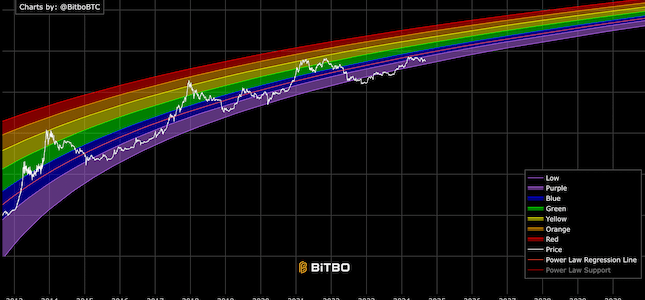
A rainbow chart based on the Bitcoin power law and time.
Bitbo's charts section offers a wide range of Bitcoin charts and metrics.
If you have any questions, comments, or feedback please reach out to us via Twitter or via email at info@bitbo.io.