
MVRV Z-Score
A chart showing Bitcoin's historical MVRV-z score.
Data & charts updated every hour
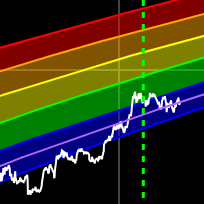
This chart plots MVRV (price divided by realized price) against 3-month rolling standard-deviation bands (90-day window).
The dashed lines show the 3-month rolling mean, mean minus 0.5 standard deviations, and mean plus 1 and 1.5 standard deviations. Green bars indicate MVRV above 1 (price above realized price); red bars indicate MVRV below 1.
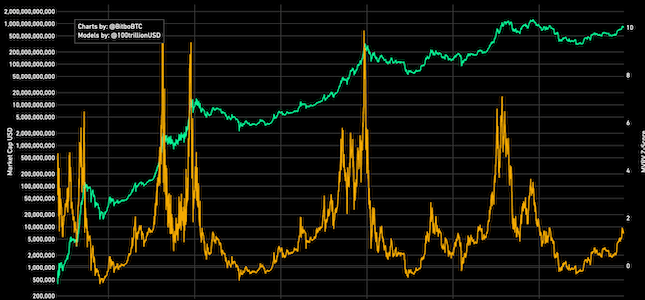
A chart showing Bitcoin's historical MVRV-z score.
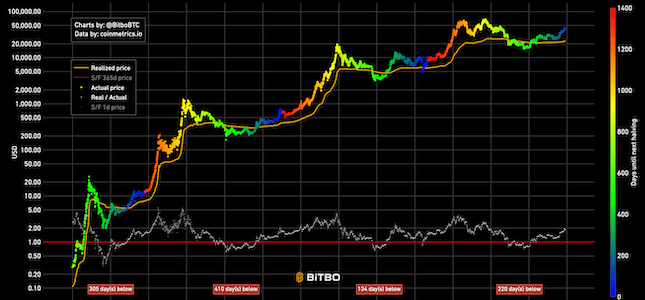
Realized price is the realized market cap divided by total amount of generated coins.
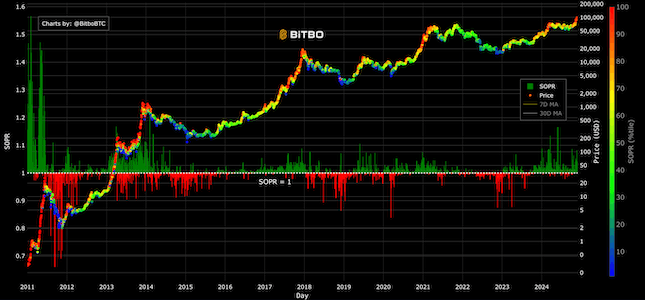
Shows whether Bitcoin is being sold at a profit or loss by comparing the value when spent to the value when acquired.
Bitbo's charts section offers a wide range of Bitcoin charts and metrics.
If you have any questions, comments, or feedback please reach out to us via Twitter or via email at info@bitbo.io.