


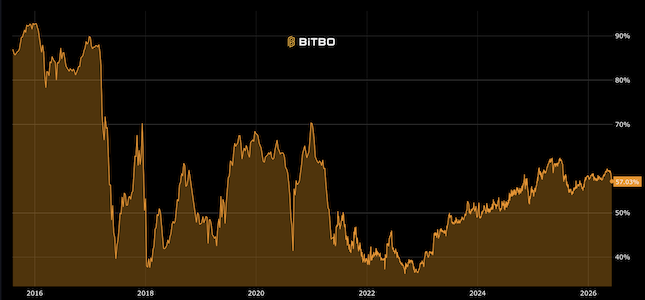
Bitcoin Dominance (BTC.D)
Shows Bitcoin's market cap dominance compared to other cryptocurrencies (live).
Data & charts updated every hour
Where price sits between the Low band (0%) and Red band (100%) on a log scale.
log10(price) = 2.6521 × LN(days) − 18.163
How much time Bitcoin has spent in each color band historically.
| Band | Days | % of History | |
|---|---|---|---|
| Below Low | 556 | 10.0% |
|
| Blue | 2,462 | 44.1% |
|
| Green | 1,491 | 26.7% |
|
| Yellow | 739 | 13.2% |
|
| Orange | 307 | 5.5% |
|
| Red | 26 | 0.5% |
|
| Year | Below | Blue | Green | Yellow | Orange | Red | Above |
|---|---|---|---|---|---|---|---|
| 2011 | - | 37% | 51% | 12% | - | - | - |
| 2012 | - | 97% | 3% | - | - | - | - |
| 2013 | - | 17% | 64% | 8% | 10% | - | - |
| 2014 | - | - | 34% | 56% | 10% | - | - |
| 2015 | - | 98% | 2% | - | - | - | - |
| 2016 | - | 100% | - | - | - | - | - |
| 2017 | - | 38% | 33% | 19% | 5% | 5% | - |
| 2018 | - | 12% | 39% | 36% | 12% | 1% | - |
| 2019 | - | 50% | 48% | 2% | - | - | - |
| 2020 | 2% | 77% | 18% | 2% | - | - | - |
| 2021 | - | - | - | 53% | 46% | 1% | - |
| 2022 | 35% | 22% | 25% | 18% | - | - | - |
| 2023 | 67% | 33% | - | - | - | - | - |
| 2024 | - | 62% | 38% | - | - | - | - |
| 2025 | - | 34% | 66% | - | - | - | - |
| 2026 | 86% | 14% | - | - | - | - | - |
Average forward returns after buying when price is in each band. Based on all historical data.
| Band | Sample Days | Avg 30d Return | Avg 90d Return | Avg 1yr Return |
|---|---|---|---|---|
| Below Low | 556 | +5.1% | +19.7% | +134.7% |
| Blue | 2,462 | +14.0% | +57.2% | +621.1% |
| Green | 1,491 | +13.3% | +41.3% | +105.6% |
| Yellow | 739 | +7.6% | +8.4% | -30.4% |
| Orange | 307 | -8.4% | -27.2% | -52.0% |
| Red | 26 | -25.1% | -49.1% | -71.6% |
When the HPR model predicted key price levels would be reached vs. when they actually were.
| Price | Model Estimate | Actually Reached | Difference |
|---|---|---|---|
| $100 | Jul 05, 2014 | Apr 01, 2013 | -460d (early) |
| $1K | Jan 08, 2017 | Nov 28, 2013 | -1137d (early) |
| $10K | Sep 06, 2020 | Dec 01, 2017 | -1010d (early) |
| $100K | Jan 09, 2026 | Dec 08, 2024 | -397d (early) |
| $250K | Oct 10, 2028 | Projected | — |
| $500K | Feb 24, 2031 | Projected | — |
| $1M | Oct 22, 2033 | Projected | — |
| $5M | Apr 13, 2041 | Projected | — |
| $10M | Feb 27, 2045 | Projected | — |
Enter a future date to see the projected rainbow band boundaries based on the halving regression model.
Which rainbow band Bitcoin was in each month, colored by band. Computed from average daily band position per month.
How well the HPR model tracked actual Bitcoin prices each year. Positive deviation = price above model, negative = below.
| Year | Avg Price | Avg HPR | Avg Deviation |
|---|---|---|---|
| 2011 | $7 | $1 | +728.7% |
| 2012 | $8 | $7 | +31.8% |
| 2013 | $189 | $31 | +397.5% |
| 2014 | $525 | $103 | +503.0% |
| 2015 | $272 | $284 | -0.2% |
| 2016 | $567 | $678 | -16.1% |
| 2017 | $3,982 | $1,453 | +140.8% |
| 2018 | $7,547 | $2,860 | +187.1% |
| 2019 | $7,379 | $5,262 | +38.1% |
| 2020 | $11,118 | $9,168 | +18.7% |
| 2021 | $47,429 | $15,253 | +214.5% |
| 2022 | $28,186 | $24,389 | +22.7% |
| 2023 | $28,862 | $37,714 | -23.9% |
| 2024 | $65,964 | $56,684 | +15.8% |
| 2025 | $101,664 | $83,052 | +23.4% |
| 2026 | $72,981 | $109,688 | -32.9% |
The Halving Price Regression (HPR) is a non-linear regressions curve calculated using only the bitcoin prices on the 3 halving dates. This method excludes the hype cycles to create a conservative trend line. The blue band is on trend (+/- 6 month) with each band above being another year ahead of the trend line. Green = 1 year ahead of trend, Yellow = 2 years ahead, etc. Logarithmic (non linear) Regression log10(price) = 2.6521LN(x)-18.163 Inputs: 28-Nov-2012 $12.33, 9-Jul-2016 $651.94, 11-May-2020 $8,591.65
Shows Bitcoin's market cap dominance compared to other cryptocurrencies (live).

Shows 4 Bitcoin price models: power law, stock to flow, stock to income, and HPR Rainbow.
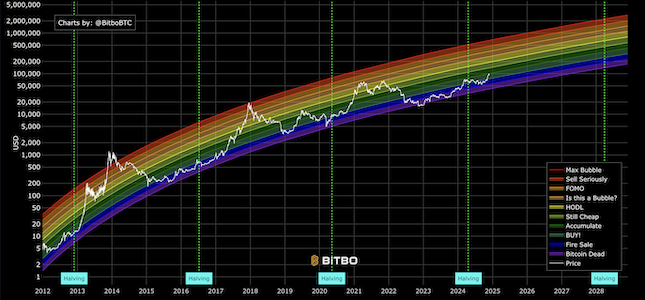
The original Bitcoin rainbow price chart showing logarithmic regression bands.