


Bitcoin Market Cycles
Attempts to pinpoint Bitcoin's cycles based on on-chain data.
Data & charts updated every hour
50MARP takes the 50-day moving average of the Bitcoin price and divides it by the 50-day moving average of the realized price.
The 50MARP Momentum indicator compares the current 50MARP value to its 3-day moving average to identify bullish and bearish momentum:
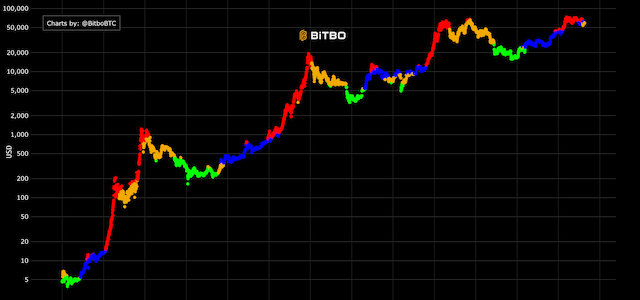
Attempts to pinpoint Bitcoin's cycles based on on-chain data.
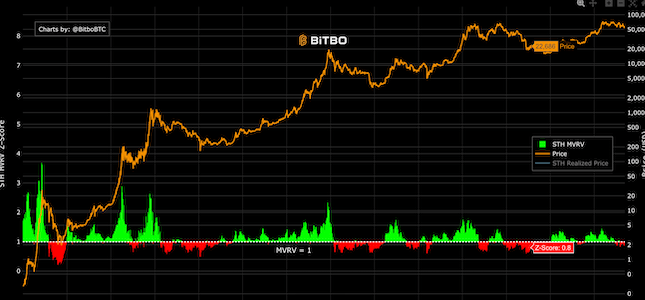
The Bitcoin price divided by the short term holder realized price.
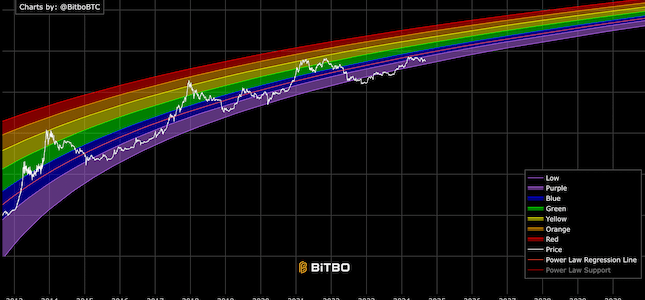
A rainbow chart based on the Bitcoin power law and time.
Bitbo's charts section offers a wide range of Bitcoin charts and metrics.
If you have any questions, comments, or feedback please reach out to us via Twitter or via email at info@bitbo.io.