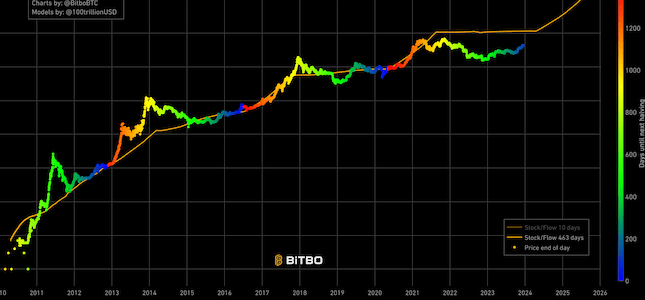
Stock to Flow
Shows the projected Bitcoin price based on the stock to flow model.
Data & charts updated every hour
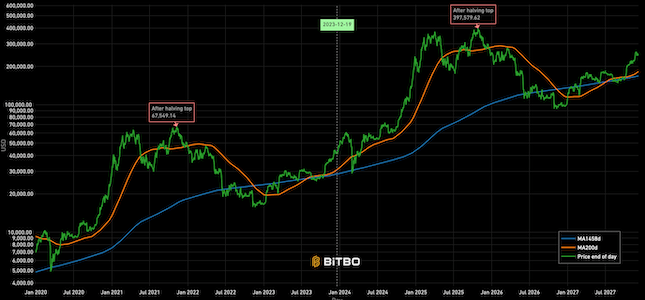
The Compare to Bull Markets chart displays historical bitcoin price data on a timeline of days since each of the block reward subsidy halvings on the x axis. These are known as ‘eras’. Each era represents the series of days within a block reward subsidy. Each new halving of the block reward subsidy marks the start of a new era.
- Era 1 represents the days in bitcoin’s history when the subsidy was 50 bitcoins
- Era 2 represents the days in bitcoin’s history when the subsidy was 25 bitcoins
- Era 3 represents the days in bitcoin’s history when the subsidy was 12.5 bitcoins
- Era 4 represents the days in bitcoin’s history when the subsidy was 6.25.
- Era 5 represents the days in bitcoin’s history when the subsidy was 3.125. This is the current era.
The y axis represents the price of bitcoin on one of these days, but then scales the prices of each previous era to show what similar moves in price would look like if using current era price data.
Breakouts from previous bull markets can be used to determine the potential for a new bull market. A breakout is determined when the price of Bitcoin breaks above the previous bull market high, and ends when the price falls below 70% of the new ATH. This chart is not to be confused with the price after halvings chart found here.
Bitbo's charts section offers a wide range of Bitcoin charts and metrics.
If you have any questions, comments, or feedback please reach out to us via Twitter or via email at info@bitbo.io.