


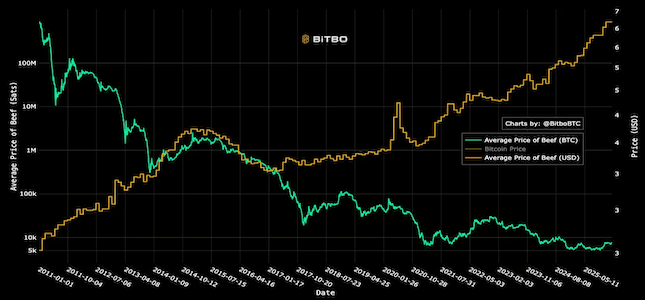
U.S. Beef Priced in Bitcoin
Shows the average price of beef priced in satoshis over time.
This chart shows the quarterly Median House Price in the United States in bitcoin (BTC).
The Median House Price is divided by the average price of Bitcoin in the same quarter to find the ratio of the two.
Shows the average price of beef priced in satoshis over time.
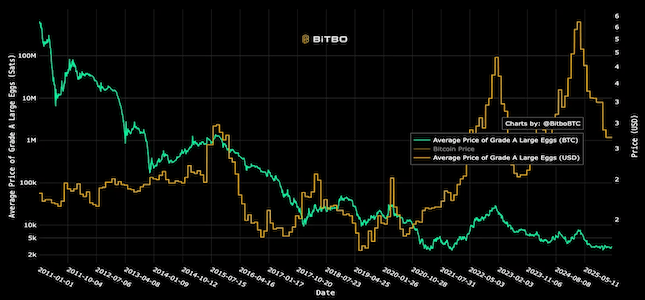
Shows the average price of Grade A large eggs priced in satoshis.
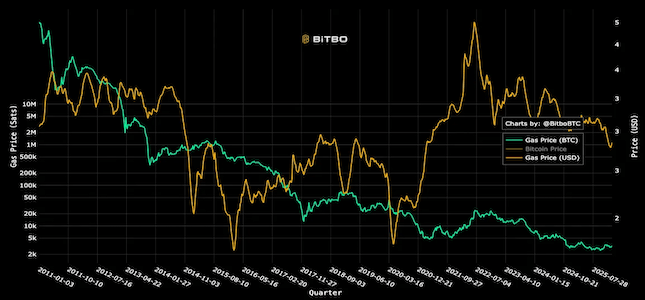
Shows the price of U.S. gasoline priced in Bitcoin.
Bitbo's charts section offers a wide range of Bitcoin charts and metrics.
If you have any questions, comments, or feedback please reach out to us via Twitter or via email at info@bitbo.io.