


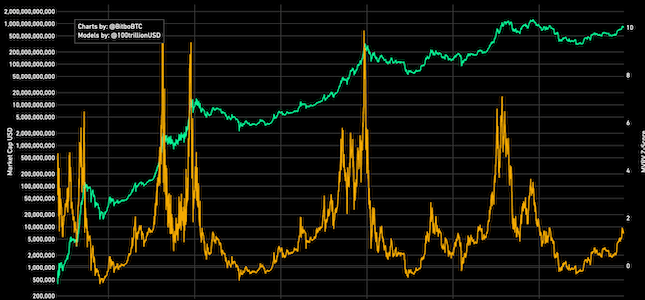
MVRV Z-Score
A chart showing Bitcoin's historical MVRV-z score.
Data & charts updated every hour
This chart takes the slope of both moving averages (111DMA and 350DMA x2) from the last 10 days and extrapolates them into the future to estimate when they might cross. The extrapolation continues until the lines intersect, which could indicate a potential future Pi Cycle Top signal.
The Pi Cycle Top Indicator is a technical tool used to identify potential peaks in Bitcoin's price cycles. Introduced by Philip Swift of LookIntoBitcoin in April 2019, it leverages two key moving averages to provide insight into when Bitcoin might be approaching a local or cycle top.
A chart showing Bitcoin's historical MVRV-z score.

A Bitcoin rainbow chart using only the halving dates as data.

Shows 4 Bitcoin price models: power law, stock to flow, stock to income, and HPR Rainbow.
Bitbo's charts section offers a wide range of Bitcoin charts and metrics.
If you have any questions, comments, or feedback please reach out to us via Twitter or via email at info@bitbo.io.